2 A Broad Collection of Datasets for Educational Research Training and Application
Abstract
In this chapter, we present the main types of data that are commonly used in learning analytics research. Learning analytics has grown to encompass the digital trails left by online learning technologies —clicks, events, and interactions—, sensor data and self-reports among others. We present a collection of curated real-life open datasets that represent the most common types of educational data. The datasets have been collected from diverse sources such as learning management systems, online forums, and surveys. These datasets are used throughout the book to illustrate methods of analysis such as sequence analysis, social network analysis, Markov models, predictive analytics and structure equation modeling, to mention a few. Each data set in the chapter is presented with its context, main properties, links to the original source, as well as a brief exploratory data analysis.
1 Introduction
Learning analytics involves the combination of different types of data such as behavioral data, contextual data, performance data, and self-reported data to gain a comprehensive understanding of the learning process [1, 2]. Each type of data provides a unique perspective of the learning process and, when analyzed together, can provide a more complete picture of the learner and the learning environment. Throughout the book, we will work with different types of learning analytics data to illustrate the analysis methods covered. This chapter explores the most common types of data that are commonly used in learning analytics and that we will work with in the subsequent book chapters. Such data include demographic and other contextual data about students, performance data, online activity, interactions with other students and teachers, and self-reported data.
This chapter also describes a set of datasets that will be used throughout the book, as well as additional datasets that may be useful for readers to put the newly learned methods into practice. We will discuss the characteristics, structure, and contents of each dataset, as well as the context in which they have been used within the book. The goal of this chapter is to give readers a solid foundation for working with the datasets used in the book, as well as to provide a starting point for those interested in exploring additional data sources.
2 Types of data
2.1 Contextual data
Contextual data refer to data that provide information about the environment in which learning takes place, such as demographic information, socioeconomic status, and prior academic achievement. This type of data can be used to understand how external factors may impact learning, to identify students with similar profiles, and to develop targeted interventions. Demographic data can be used to understand the characteristics of the learners, such as age, gender, race, and ethnicity [3]. Socioeconomic data can be used to examine the impact of the socio-economic status of learners, such as income, employment status, and education level [4]. Prior academic achievement data can be used to understand how the academic background of the learners, such as their previous grades and test scores, may influence their learning at present [5]. The data about the learning context is also relevant to better understand and support students; for example, the level and difficulty of the educational program and courses, format (online vs. face-to-face), or pedagogical approach (e.g., flipped classroom, laboratory course, etc.) [6].
Descriptive statistics can be used to summarize and describe the main characteristics of the contextual data, such as the mean, median, and standard deviation. In Chapters 3 [7] and 4 [8], we will learn how to clean and manipulate data and how to summarize it using descriptive statistics. In Chapter 6 [9], we will learn how to create different types of plots that will allow us to better understand the data. Cluster analysis can also be used to group similar students together. This can be used to identify patterns in the data and, for example, to understand which different groups of students exist in a course or degree and whether such groups differ in terms of, e.g., performance [10]. We cover clustering in Chapters 8 and 9 [11, 12].
It is important to bear in mind that contextual data are essential to understand learners’ and the learning process, but they should be used in combination with other types of data to obtain a comprehensive understanding [13]. It is also crucial to comply with data protection laws and regulations and to consider the ethical implications of collecting and operationalizing this type of data, especially when it comes to the existence of bias when making decisions based on contextual data [14].
2.2 Self-reported data
Self-reported data refers to data provided by students themselves (or other relevant stakeholders), such as data collected through surveys or questionnaires. This type of data can provide valuable insight into learners’ and teachers’ attitudes, motivation, and perspectives on their learning experiences, and can be used to inform the design of educational programs [15]. It is important to keep in mind that the data should be cleaned and pre-processed before applying any analytical techniques, especially when dealing with qualitative data (e.g., free text, video, or recordings), and the results should be interpreted with caution, keeping in mind the limitations of self-reported data [16].
Regarding the techniques employed to analyze self-reported data, descriptive statistics and data visualization are commonly used to understand the distribution of responses and to identify patterns in the data (see Chapters 4 [8] and 6 [9]). Moreover, inferential statistics can be used to make inferences about a population based on a sample of data. This can include techniques such as t-tests and analysis of variance to identify significant differences between groups or chi-squared tests to identify associations in the data. Chapter 5 will help us better understand the most common statistical tests and how to implement them with R [17]. Depending on the research question, the type of data, and the level of detail required, a more sophisticated choice of analytical techniques might be needed. For instance, Factor Analysis is a statistical technique that can be used to identify underlying factors or dimensions that explain the relationships between multiple variables [18]. We will learn about it in Chapter 20 [19]. Similarly, Structural Equation Modeling (SEM) can be used to test complex models that involve multiple observed and latent variables that depend on one another. We cover this method in Chapter 21 [20]. Moreover, self-reported data can be analyzed using psychological networks, a relatively new approach in the field of psychology that focuses on understanding psychological phenomena as interconnected networks of individual components. We cover this method in Chapter 19 [21]. Lastly, text mining can be used to analyze unstructured data, such as open-ended responses to surveys or interviews. It can be used to identify key concepts and themes, perform sentiment analysis, and summarize text [22]. This type of analysis is beyond the scope of this book.
2.3 Activity data
Activity data in learning analytics refers to the data that is collected about a student’s interactions with educational technology. Activity data can include information such as the learning resources a student visits, the time spent on a resource, the buttons clicked, and the messages posted [23]. Data can be collected automatically by the learning management system (LMS) or other educational technology (e.g., a game, an intelligent tutoring system, eBooks, or coding environments). Log activity data can be used to track student progress, identify areas where students may be struggling, and personalize instruction [24]. For example, if a student is spending an excessive amount of time on a particular concept, it may indicate that they are having difficulty understanding that concept. In this case, the teacher can provide additional support or re-teach the concept to help the student improve. Log activity data can also be used to measure student engagement with the course content and to identify students who are not engaging with the material [25]. Log activity data have been used to detect students’ online tactics and strategies [26] paying attention not only to the frequency but to the order and timing of students’ events.
Besides basic analysis using descriptive and inferential statistics, activity logs have been operationalized in many ways in learning analytics, especially using temporal methods that allow to take advantage of the availability of large amounts of timestamped data. For example, process mining — which we cover in Chapter 14 [27] — has been used to investigate how students navigate between different online activities [28]. Sequence analysis has been used to detect and interpret students’ online tactics and strategies based on the order of learning activities within learning sessions [29]. We dedicate several chapters to this technique [30–33]. Such analyses have been complemented with cluster analysis, which allows to detect distinct patterns of students with different online behavior [34] (see Chapters 8 and 9 [11, 12]).
2.5 Performance data
Performance data refers to data that measures how well learners are able to apply what they have learned. This type of data can be used to evaluate the effectiveness of a particular educational activity, to identify areas where additional support may be needed, or to detect students at risk. Performance includes assessment data from tests, quizzes, projects, essays, exams, and other forms of evaluation used to track students’ progress. Assessment can be performed by different entities, such as teachers, peers or automated assessment tools. Moreover, assessment data can have different levels of granularity: it can be the grade for a specific task, a midterm or final exam, or a project; it can be the final grade for a course, or even a whole program GPA [44]. Performance data used for learning analytics may not necessarily be assessment data. For instance, pre-test and post-test data are used to evaluate the effectiveness of a particular educational intervention [45]. Another example is the data captured by audience response systems (ARSs) [46], which are often used to evaluate learners’ knowledge retention during lectures.
Performance data are rarely analyzed on its own, but rather used in combination with other sources of data. For example, a common use case in learning analytics is to correlate or predict grades with indicators from several sources [13, 47], such as demographic data, activity data or interaction data. In the book, we cover predictive modelling in Chapter 7 [48]. Moreover, grades are often compared among groups or clusters of students, for example, to evaluate the performance of students that use different online learning strategies [29] or to establish whether students’ assuming different levels of collaboration also show differences in performance [49]. Clustering is covered in Chapters 8 and 9 [11, 12].
2.6 Other types of data
In recent years, the landscape of data used for learning analytics has undergone a remarkable expansion beyond demographics, grades, surveys and digital logs [50]. This evolution has led to the incorporation of novel methodologies designed to capture a more holistic understanding of students’ learning experiences, including their physiological responses [51]. This progression encompasses a diverse range of data acquisition techniques, such as eye-tracking data that traces the gaze patterns of students, electrodermal activity which measures skin conductance and emotional arousal, EEG (electroencephalogram) recordings that capture brain activity patterns, heartbeat analysis reflecting physiological responses to learning stimuli, and motion detection capturing physical movements during learning activities [52]. These physiological datasets are often combined with other forms of information, such as video recordings (e.g., [50]). Combining various data modalities allows researchers and educators to gain a better understanding of how students engage with educational content and respond to different teaching methodologies [51]. This analysis goes beyond the capabilities of conventional digital learning tools, offering insights into the emotional, cognitive, and physical aspects of learning that might otherwise remain concealed [53, 54]. This synergistic analysis of multiple data sources is often referred to as “multimodal learning analytics”. In Chapter 13, we will cover multi-channel sequence analysis, a method suitable for analyzing several modalities of data at the same time [33].
3 Dataset selection
The present section describes a set of curated datasets that will be used throughout the book. In the introductory chapters, the reader will learn how to import datasets in different formats [7], clean and transform data [8], conduct basic statistics [17], and create captivating visualizations [9]. Each of the remaining chapters covers a specific method, which is illustrated in a tutorial-like way using one or more of the datasets described below. All the datasets are available on Github (https://github.com/lamethods/data).
3.1 LMS data from a blended course on learning analytics
The first dataset in our book is a synthetic dataset generated from a real blended course on Learning Analytics offered at the University of Eastern Finland. The course has been previously described in a published article [55] which used the original (non-synthetic) dataset. The lectures in the course provided the bases for understanding the field of learning analytics: the recent advances in the literature, the types of data collected, the methods used, etc. Moreover, the course covered learning theories as well as ethical and privacy concerns related to collecting and using learners’ data. The course had multiple practical sessions which allowed students to become skilled in learning analytics methods such as process mining and social network analysis using real-life datasets and point-and-click software.
Students in the course were required to submit multiple assignments; most of them were practical, in which they had to apply the methods learned in the course, but others were focused on discussing learning theories, ethics, and even conducting a small review of the literature. The course had a final project that accounted for 30% of the course final grade in which students had to analyze several datasets in multiple ways and comment and discuss their findings. Moreover, there was a group project in which students had to present an implementation of learning analytics application in an institutional setting, discussing the sources of data collection, the analyses that could be conducted, and how to present and make use of the data and analyses. The course was implemented in a blended format: instruction was face-to-face while the learning materials and assignments were available online, in the Moodle LMS. Discussions among students in the group project also took place online in the LMS forum.
The dataset contains four files: a file containing students’ online activities in Moodle, a file containing their grades, a file containing their demographic data, and a file that aggregates all the information. It is shared with a CC BY 4.0 license, which means that anyone is free to share, adapt, and distribute the data as long as appropriate credit is given. The dataset has been used in the introductory chapters of the book to learn the basics of R [7], data cleaning [8], basic statistics [17] and data visualization [9]. Moreover, it has been used in two additional chapters to illustrate to well-known learning analytics methods: sequence analysis [30] and process mining [27]. Below, we provide further details on each of the files of the dataset.
3.1.1 Events
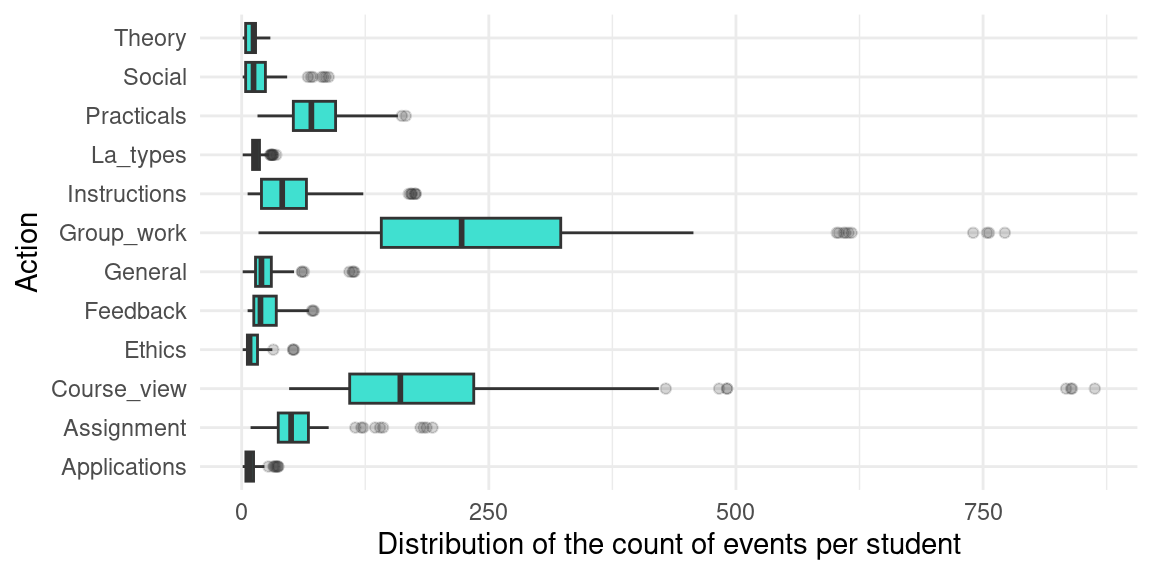
The Events.xlsx file contains 95,580 timestamped Moodle logs for 130 distinct students. The activities include viewing the lectures, discussing on forums, and working on individual assignments, as well as discussion in small groups, among other events. The logs were re-coded to balance granularity with meaningfulness, i.e., grouping together logs that essentially represent the same action. For example, the activities related to the group project were all coded as Group_work, log activities related to feedback were coded as Feedback, logs of students’ access to practical resources or assignments were coded as Practicals, social interactions that are unrelated to learning were coded as Social, etc. Below we describe the columns of the dataset and show a preview. In Figure 2.1, we show the distribution of events per student.
- Event.context: Resource of the LMS where the event takes place, for example “Assignment: Literature review”.
- user: User name in the LMS.
- timecreated: Timestamp in which each event took place, ranging from September 9th 2019 to October 27th 2019.
- Component: Type of resource involved in the event. There are 13 distinct entries, such as Forum (39.11%); System (34.33%); Assignment (15.50%) and 10 others.
- Event.name: Name of the event in Moodle. There are 27 distinct entries, such as Course module viewed (35.89%); Course viewed (26.28%); Discussion viewed (13.77%) and 24 others.
- Action: Column coded based on the combination of the event name and context. There are 12 distinct entries, such as Group_work (34.25%); Course_view (26.45%); Practicals (10.48%) and 9 others.
3.1.2 Demographics
The Demographics.xlsx file contains simulated demographic data on the students, including name, date of birth, gender, location (on-campus vs. remote student), and employment status. Below, we describe the columns of the dataset and show a preview of the data.
- user: User identifier in the learning management system, with 130 distinct entries.
- Name: User’s first name.
- Surname: User’s last name.
- Origin: Country of origin.
- Gender: User’s gender: F (Female, 50%) or M (Male, 50%).
- Birthdate: Date of birth.
- Location: Whether the student is on campus or studying remotely, with 2 distinct entries, such as On campus (81.54%); Remote (18.46%).
- Employment: Whether the student is working part-time, full-time or not at all, with 3 distinct entries, such as None (70.77%); Part-time (25.38%); Full-time (3.85%).
3.1.3 Results
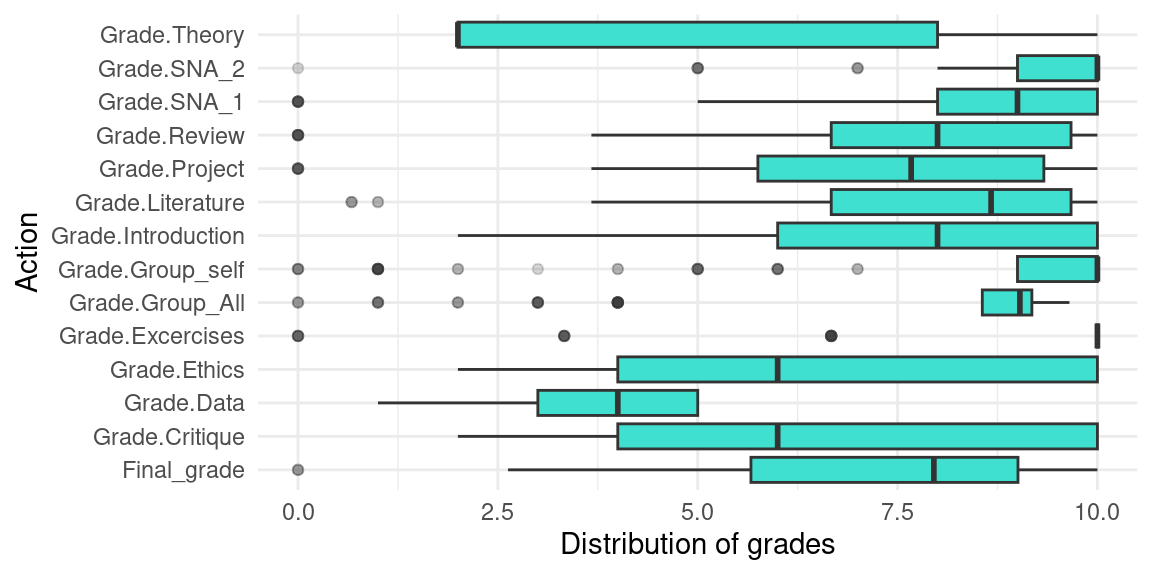
Performance data is provided in the Results.xlsx file, including grades per assignment and the overall course grade. Below we describe the dataset columns and show a preview of the data (the column names have been abbreviated in the preview). Figure 2.2 shows the distribution of grades per graded item.
- user: User name in the learning management system (it matches the previous files).
- Grade.SNA_1: Grade of the first SNA assignment (0-10).
- Grade.SNA_2: Grade of the second SNA assignment (0-10).
- Grade.Review: Grade of the studies’ review assignment (0-10).
- Grade.Group_self: Individual grade of the group project (0-10).
- Grade.Group_All: Group grade of the group project (0-10).
- Grade.Excercises: Grade of the practical exercises (0-10).
- Grade.Project: Final project grade (0-10).
- Grade.Literature: Grade of the literature review assignment (0-10).
- Grade.Data: Grade of the data analysis assignment (0-5).
- Grade.Introduction: Grade of the introductory assigment (0-10).
- Grade.Theory: Grade of the theory assignment (0-10).
- Grade.Ethics: Grade of the ethics assignment (0-10).
- Grade.Critique: Grade of the critique assignment (0-10).
- Final_grade: Final course grade (0-10).
3.1.4 AllCombined
This file AllCombined.xlsx contains the students’ demographics, grades, and frequency of each action in the LMS. The columns from students’ demographic data and grades remain the same, while the event data has been grouped per student for each type of event (Action column in the Events dataset), i.e., there is a new column for each type of event that contains the number of events of that type that each student had. Moreover, a new column AchievingGroup separates the high achievers from the low achievers. Below we show a preview of the new columns of the data (the column names have been abbreviated) that were not shown in the previous previews and describe them.
- Frequency.Applications: Number of events related to the “Applications” resource.
- Frequency.Assignment: Number of events related to the assignments’ submission.
- Frequency.Course_view: Number of visits to the course main page.
- Frequency.Feedback: Number of views of the assignment feedback.
- Frequency.General: Number of events related to general learning resources.
- Frequency.Group_work: Number of events related to the group work.
- Frequency.Instructions: Number of events related to assignment instructions.
- Frequency.La_types: Number of events related to the “LA types” resource.
- Frequency.Practicals: Number of events related to the practicals.
- Frequency.Social: Number of events related to the forum discussion.
- Frequency.Ethics: Number of events related to the “Ethics” resource.
- Frequency.Theory: Number of events related to the “Theory” resource.
- Frequency.Total: Number of events overall.
- AchievingGroup: Categorization as high achievers (top 50% grades) and lows achievers (bottom 50% grades).

3.2 LMS data from a higher education institution in Oman
The next dataset includes students’ log data enrolled in computing specialization a higher education institution in Oman. The dataset contains data from students enrolled in the sixth semester or beyond. The data was recorded across five modules (Spring 2017-2021) and includes the records of 326 students with 40 features in total, including the students’ academic information (24 features), logs of students’ activities performed on the Moodle LMS (10 features), and students’ video interactions on the eDify mobile application (6 features). The academic data includes demographic data, academic data, study plan, and academic violations. The Moodle activity data includes students’ timestamped activities in Moodle. The eDify data contains video interactions in the eDify mobile application.
The dataset has been described in an article by Hasan et al. [56] and was originally made available in the Zenodo repository [57] with a CC BY 4.0 license, which means anyone can share and adapt the dataset but must give credit to the author and cannot apply any further restrictions to the dataset. Besides the raw data, the dataset includes a processed file that contains a series of indicators that can be used for different purposes such as predictive modeling or clustering of students’ profiles. It has been used in several publications with the purpose of predicting student performance using different algorithms and approaches [58, 59]. The main files of the dataset are described below.
3.2.1 Student academic information
Students’ academic information downloaded from the institutional information system. The data are spread in 15 files (starting with KMS), but have been combined in a single file (KMSmodule.RDS) for convenience. Below we show a preview of the data and its structure:
- file: Original file name that contains the module offering identifier (e.g., “KMS Module 1 F19.csv”). There are 15 distinct entries (one for each file).
- ModuleCode: Module identifier (Module 1-5).
- ModuleTitle: Name of the module (Course 1-5).
- SessionName: Class section in which the student has been enrolled (Session-A or Session-B).
- RollNumber: Student identifier (e.g., “Student 83”). There are 306 distinct students.
- CGPA: Students’ cumulative GPA (1-4).
- AttemptCount: Number of attempts per student and module.
- Advisor: Students’ advisor identifier (e.g., ‘Advisor 16’). There are 50 distinct advisors.
- RemoteStudent: Whether the student is studying remotely. There are 2 possible values: Yes (0.31%) or No (99.69%).
- Probation: Whether the student has previous incomplete modules. There are 2 possible values: Yes (3.36%) or No (96.64%).
- HighRisk: Whether the module has a high risk of failure. There are 2 possible values: Yes (6.73%) or No (93.27%).
- TermExceeded: Whether the student is progressing in their degree plan. There are 2 possible values: Yes (1.83%) or No (98.17%).
- AtRisk: Whether the student has failed two or more modules in the past. There are 2 possible values: Yes (23.55%) or No (76.45%).
- AtRiskSSC: Whether the student has been registed for having any educational deficiencies. There are 2 possible values: Yes (4.59%) or No (95.41%).
- OtherModules: Number of other modules the student is enrolled in on the same semester.
- PrerequisiteModules: Whether the student has enrolled in the prerequistide module.
- PlagiarismHistory: Modules for which the student has a history of plagiarism.
- MalPracticeHistory: Modules for which the student has a history of academic malpractice.
3.2.2 Moodle
The Moodle data is spread around 15 files (starting with Moodle), which contain all the clicks that students performed in the Moodle LMS in each module. The 15 files have been combined in a single file (moodleEdify.RDS) for convenience. Below is a preview of the data and a description of its structure:
- csv: Module offering identifier. There are 15 distinct entries (one for each file).
- Time: Timestamp in which the event occurred, ranging between January 1st 2018 to December 9th 2020.
- Event context: Resource of the LMS where the event takes place, for example “File: Lecture 4”.
- Component: Type of resource involved in the event. There are 16 distinct entries, such as System (51.71%); File (22.30%); Turnitin Assignment 2 (15.04%) and 13 others.
- Event name: Name of the event in Moodle. There are 70 distinct entries, such as Course viewed (36.59%); Course module viewed (25.98%); List Submissions (11.08%) and 67 others.
3.2.3 Activity
Aggregated information per student based on the Moodle data, including the activity on campus and at home. The data are also spread in 15 files (starting with Activity), but has been combined in a single file (ActivityModule.RDS) for convenience. Below we show a preview of the data and its structure:
- file: Original file name that contains the module offering identifier (e.g., “Activity Module 1 F19.csv”). There are 15 distinct entries (one for each file).
- RollNumber: Student identifier (e.g., “Student 208”).
- Online C: Duration of the activity (in minutes) within campus.
- Online O: Duration of the activity (in minutes) off campus.
3.2.4 Results
Student performance data in each module. The data are also spread in 10 files (starting with Result), but has been combined in a single file (ResultModule.RDS) for convenience.Below we show a preview of the data and its structure:
- file: Original file name that contains the module offering identifier (e.g., “Result Module 1 F19.csv”). There are 10 distinct entries (one for each file).
- RollNumber: Student identifier (e.g., “Student 208”). There are 326 distinct students.
- SessionName: Class section, Session-A (84.66%), or Session-B (9.82%).
- CW1: Grade of students’ first assignment (0-100).
- CW2: Grade of students’ second assignment (0-100).
- ESE: Grade of students’ end-of-semester examination (0-100).
3.2.5 eDify
Student aggregated activity data in the eDify mobile application. The data are also spread in 15 files (starting with VL), but has been combined in a single file (VLModule.RDS) for convenience. Below we show a preview of the data and its structure:
- file: Original file name that contains the module offering identifier (e.g., “Result Module 1 F19.csv”). There are 15 distinct entries (one for each file).
- RollNumber: Student identifier (e.g., “Student 208”). There are 326 distinct students.
- Played: Number of times the student has played a video.
- Paused: Number of times the student has paused a video.
- Likes: Number of times the student has liked a video.
- Segment: Number of times a student has scrolled to a specific part of the video.
3.3 School engagement, academic achievement, and self-regulated learning
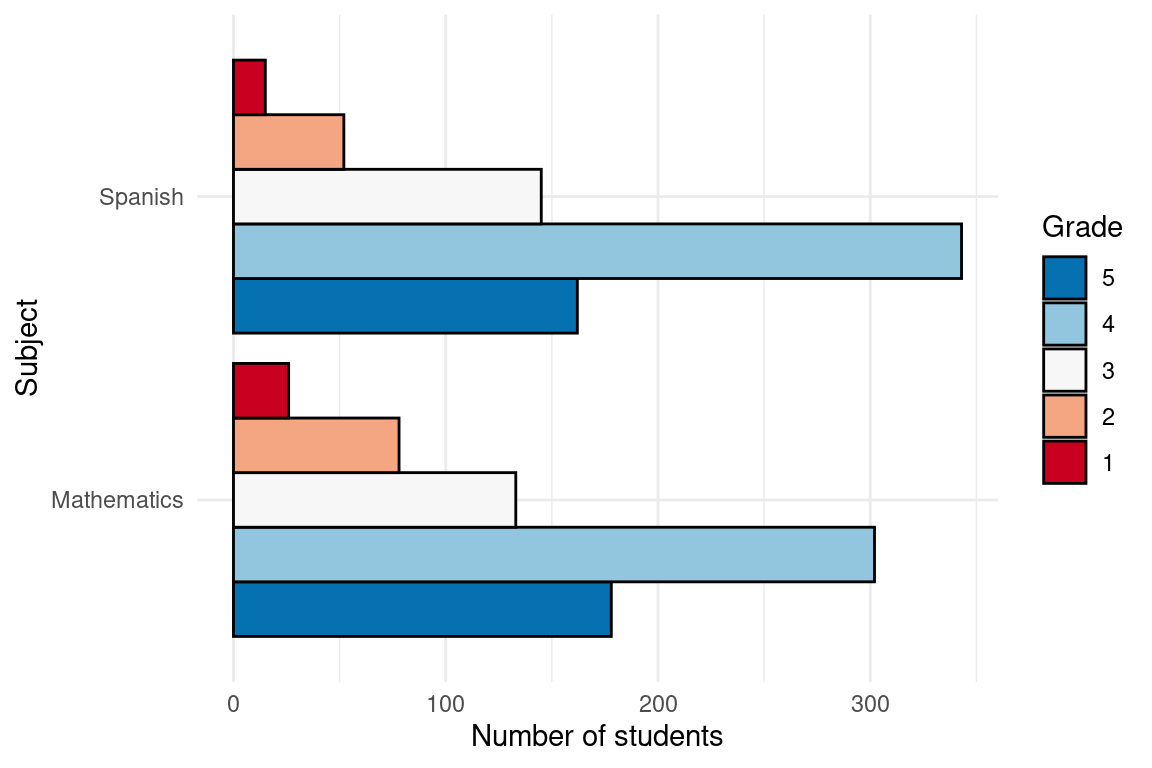
This dataset includes measures of school engagement, self-regulation and academic performance of a group of primary school students in northern Spain [60]. The data contains responses to the questionnaire from 717 primary education students. The subjects were recruited using convenience sampling from 15 schools (5 privately funded and 10 publicly funded) in northern Spain. The objective of collecting these data was to characterize school engagement and to explore to which extent different engagement profiles are associated with academic performance and self-regulation. In the questionnaire, engagement was assessed with the school engagement measure [61], which allows to differentiate between behavioral, cognitive and emotional engagement. Self-regulation was assessed using the self-regulation strategy inventory [62], which allows measuring students’ approaches to seeking and learning information, maladaptive regulatory behavior, environment management, and time management. The measure used for achievement was students’ self-reported information about their grades in Spanish and mathematics on a scale of 1 (fail) to 5 (outstanding).
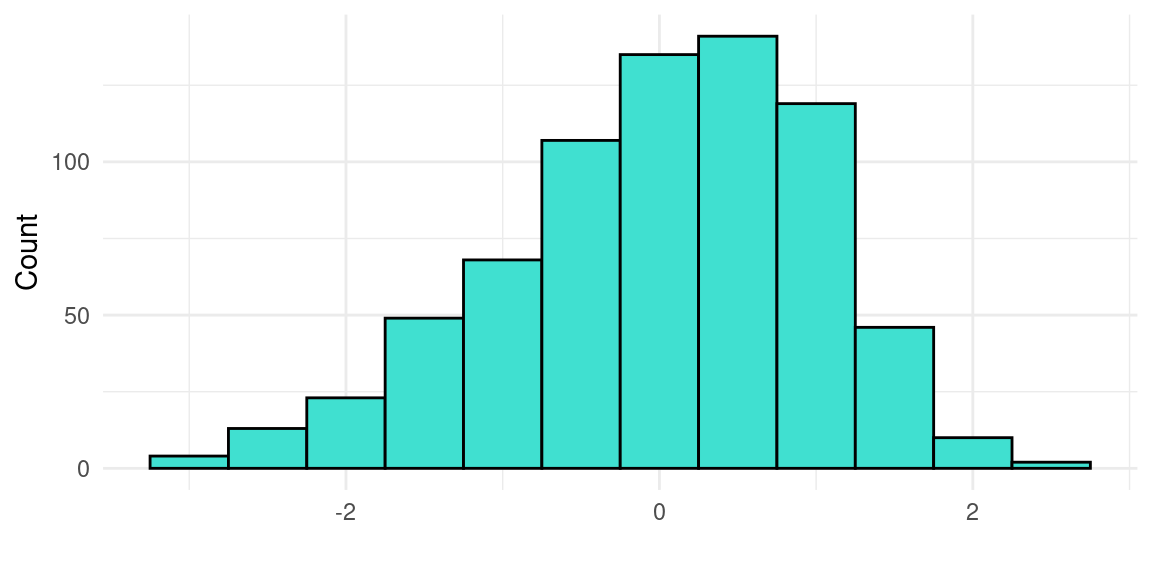
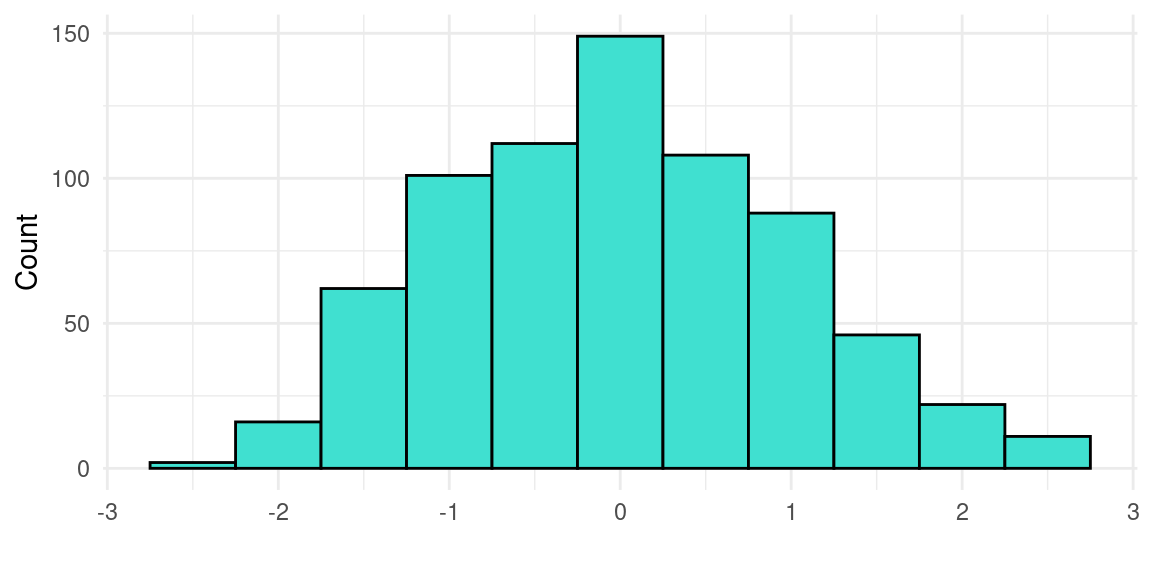
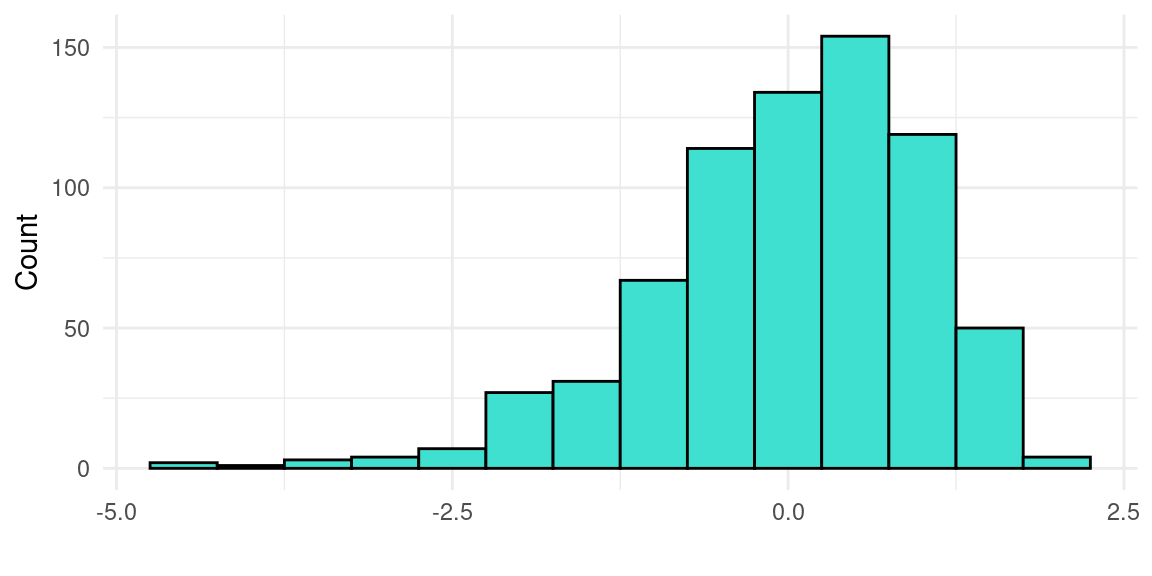
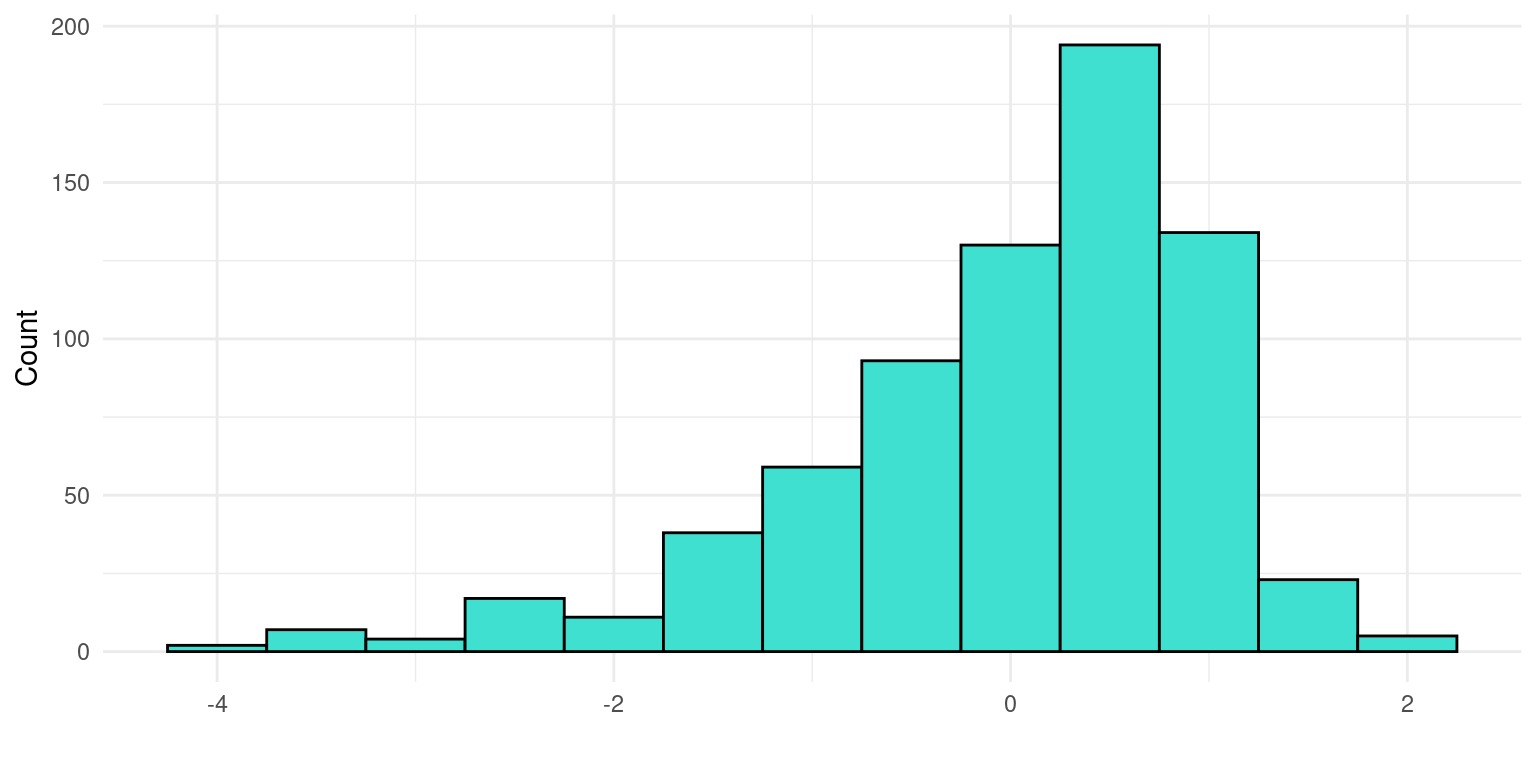
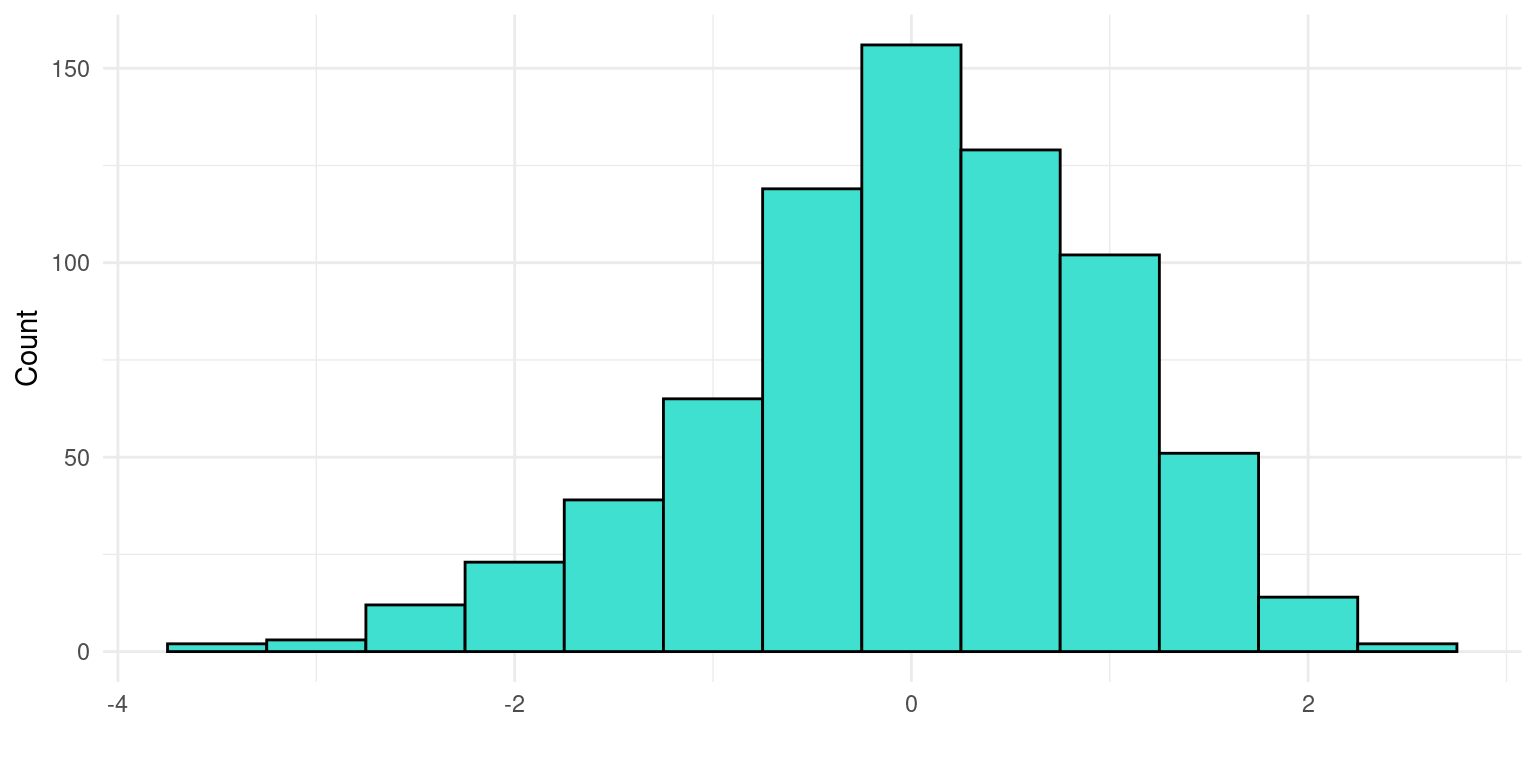
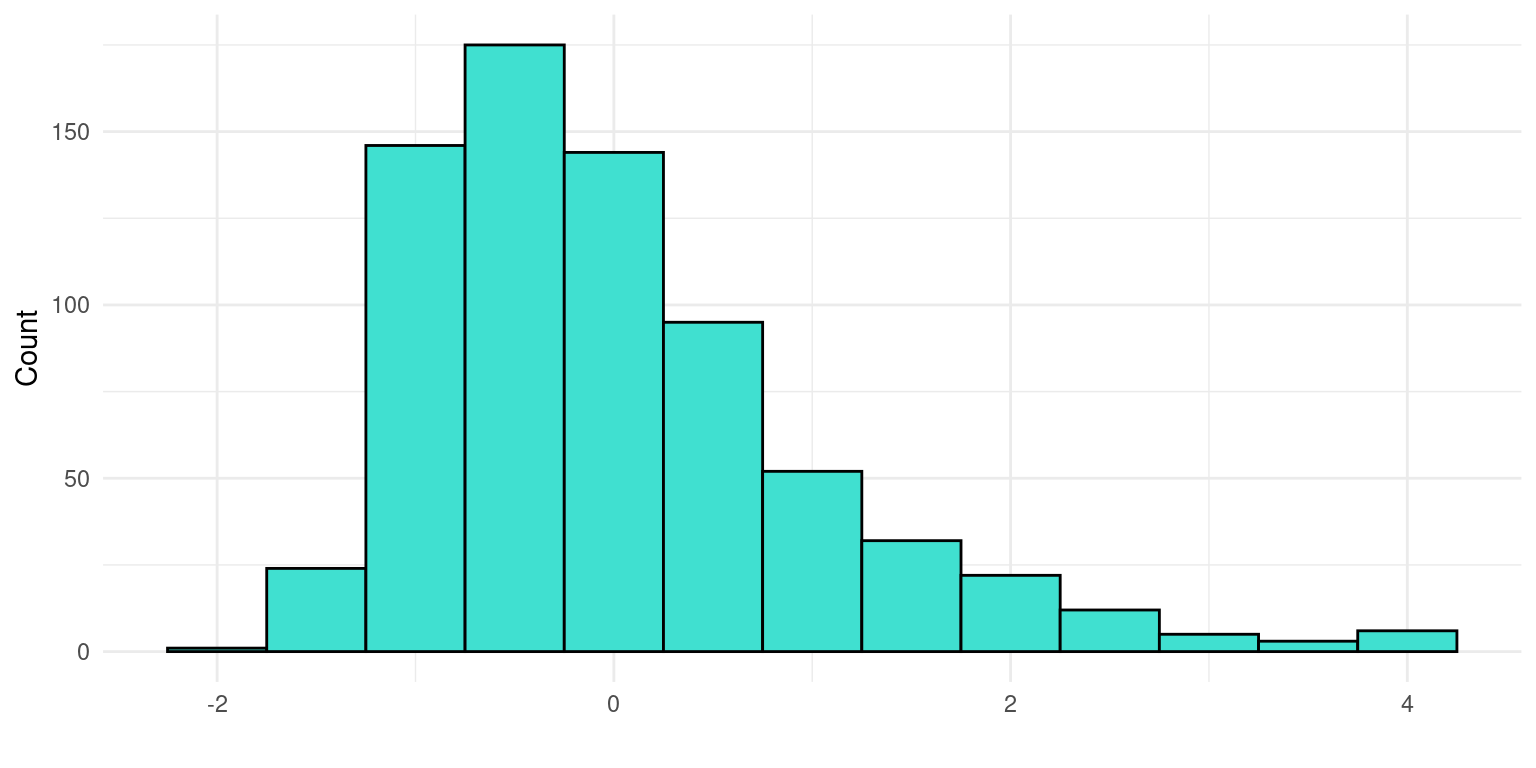
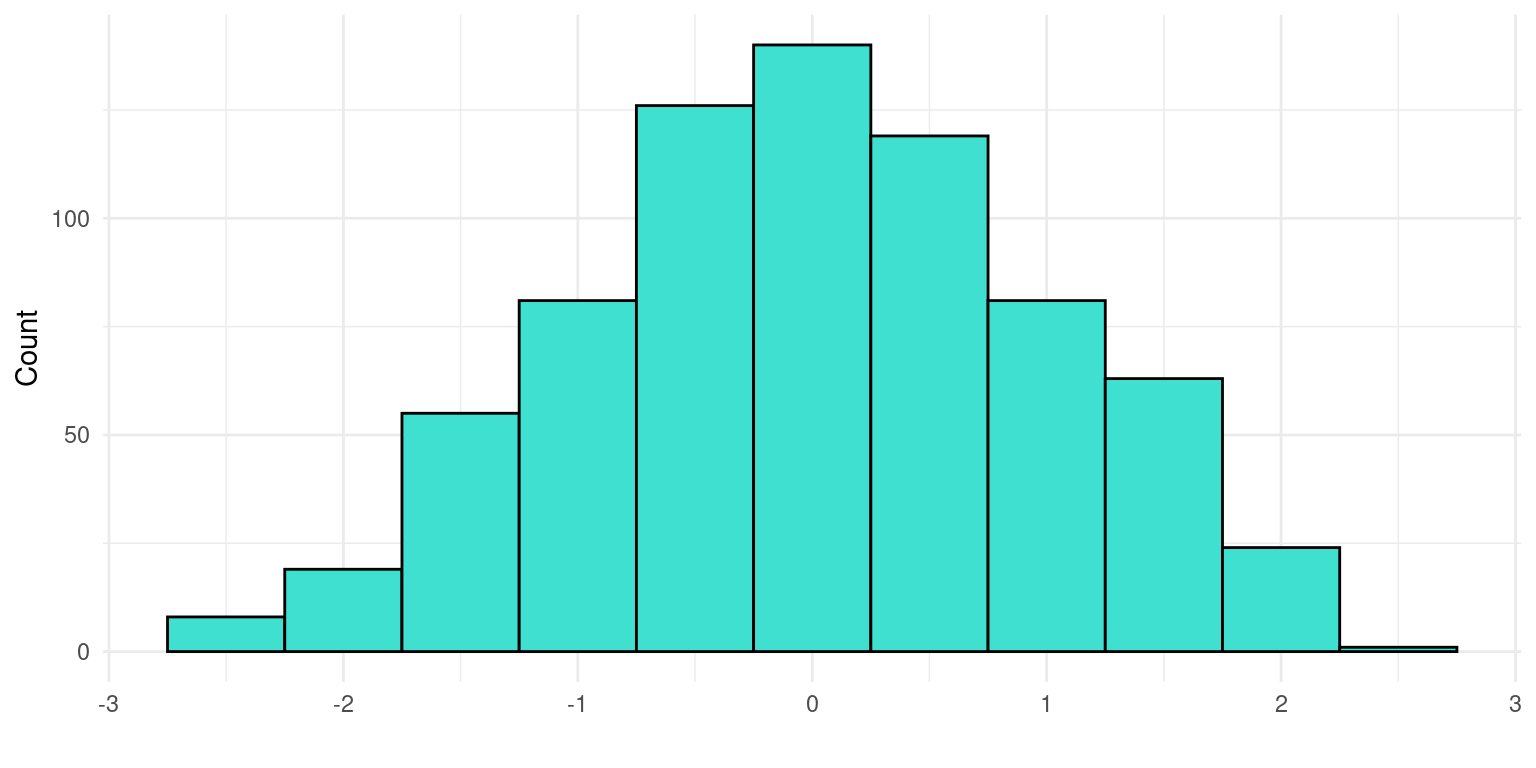
Figure 2.4 summarizes the responses of the students in both subjects, Figure 2.5 presents a set of histograms with the engagement measures, and Figure 2.6 includes a set of histograms with the self-regulation measures. The dataset was analyzed in a previous article [63], where the authors carried out cluster analysis using LPA (Latent Profile Analysis) to identify different groups of students according to their engagement and self-regulation and to compare the performance between these groups. The dataset is used in Chapter 9 [11] of this book, which covers model-based clustering. The dataset is published with a CC BY 4.0 license, which means that you can share, copy and modify this dataset so long as appropriate credit is given. Below we show a preview of the dataset and describe its main variables.
- alumno: Student identifier in the school.
- sexo: Student’s gender (1 = Male, 48.40%; 2 = Female, 51.46%).
- coleg: School identifier (1-15).
- curso: Grade that students were in 5th grade (62.48%) or 6th grade (37.52%).
- grup: Class section (1-3).
- ren.mat: Mathematics self-reported academic achievement (1-5).
- ren.leng: Spanish self-reported academic achievement (1-5).
- Emotion_Engage: Emotional engagement (z-score).
- Cognitive_Engage: Cognitive engagement (z-score).
- Behavior_Engage: Behavioural engagement (z-score).
- Enviroment_Manage: Environment management (z-score).
- Information_help_Manage: Information and help management (z-score).
- Maladapative_Behavior: Maladaptative self-regulation (z-score).
- Time_Manage: Time management self-regulation (z-score).
3.4 Teacher burnout survey data
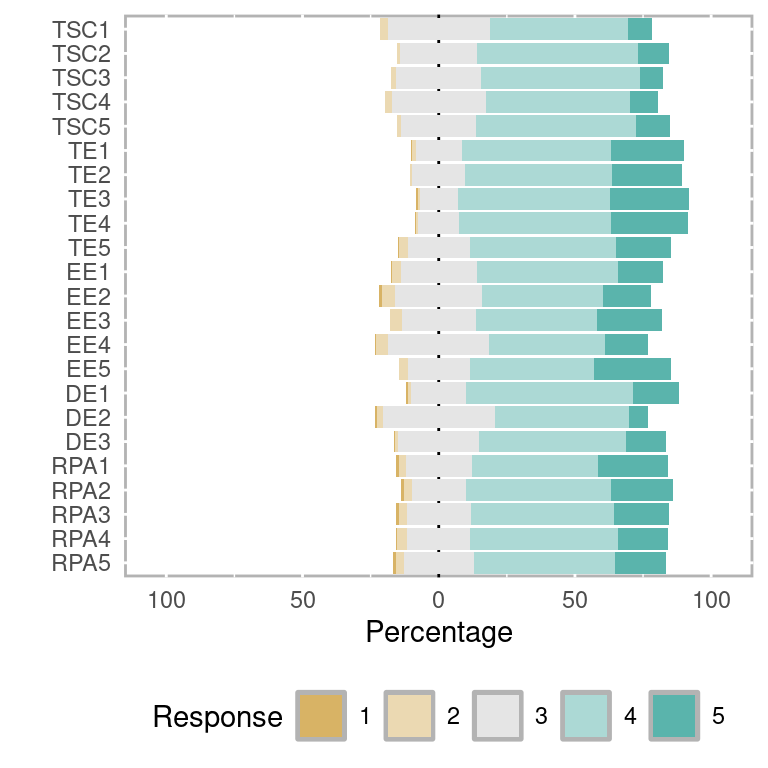
The next dataset presents the responses collected from a survey about teacher burnout in Indonesia [64]. The survey questionnaire contains 18 items in five different categories. The first category contains five items to assess the teacher self-concept (TSC), from the TSC Evaluation Scale [65]. The second category is teacher efficacy (TE), with 5 items adapted from [66]. The remaining categories are Emotional Exhaustion (EE, 5 items), Depersonalization (DP, 3 items), and Reduced Personal Accomplishment (RPA, 5 items), adapted from the Maslach burnout inventory [67]. The survey items were measured using a 5-point Likert scale, where 1 represents “never”, and 5 represents “always”.
Below we show a preview of the dataset with the questions and answers, which can be visualized in Figure 2.7 using a Likert scale chart. The dataset has been analyzed using several statistical methods [68]: Content Validity Index (CVI), Exploratory Factor Analysis (EFA), Confirmatory Factor Analysis (CFA), Covariance-Based SEM (CB-SEM). The main aim was to determine the factors that may be predictors of teacher burnout. In this book, we also make use of this dataset to illustrate Factor Analysis [19] and SEM [20]. The files associated with this dataset are licensed under a CC BY 4.0 license, which means you can share, copy and modify this dataset so long as appropriate credit is given to the authors. The variables of the dataset are described below.
- Teacher self-concept
- TSC1: Response to the item “I think I have good teaching skills and ability”.
- TSC2: Response to the item “I have a reputation for being an efficient teacher”.
- TSC3: Response to the item “My colleagues regard me as a competent teacher”.
- TSC4: Response to the item “I feel I am a valuable person”.
- TSC5: Response to the item “Generally speaking, I am a good teacher”.
- Teacher efficacy
- TE1: Response to the item “I help my students value learning”.
- TE2: Response to the item “I motivate students who show low interest in schoolwork”.
- TE3: Response to the item “I improve understanding of students who are failing”.
- TE4: Response to the item “I provide appropriate challenges for very capable students”.
- TE5: Response to the item “I get students the students to follow classroom rules”.
- Emotional exhaustion
- EE1: Response to the item “I feel emotionally drained from my work”.
- EE2: Response to the item “I feel used up at the end of the workday”.
- EE3: Response to the item “I feel fatigued when I get up in the morning and have to face another day on the job”.
- EE4: Response to the item “I feel burnt out from my work”.
- EE5: Response to the item “Working with people all day is really a strain on me”.
- Depersonalization
- DE1: Response to the item “I’ve become more callous toward people since I took this job”.
- DE2: Response to the item “I worry that this job is hardening me emotionally”.
- DE3: Response to the item “I feel frustrated by my job”.
- Reduced Personal Accomplishment
- RPA1: Response to the item “I cannot easily create a relaxed atmosphere with my students”.
- RPA2: Response to the item “I do not feel exhilarated after working closely with my students”.
- RPA3: Response to the item “I have not accomplished many worthwhile things in this job”.
- RPA4: Response to the item “I do not feel like I’m at the end of my rope”.
- RPA5: Response to question “In my work, I do not deal with emotional problems very calmly”.
3.5 Interdisciplinary academic writing self-efficacy
This dataset contains the result of nursing students’ responses to the Situated Academic Writing Self-Efficacy Scale (SAWSES) [69] questionnaire for interdisciplinary students (543 undergraduate and 264 graduate). Participating students were recruited from three higher education institutions and from the general public using social media. The survey contains 16 items based on Bandura’s self-efficacy theory [70] and the model proposed by [71].
The questionnaire items are related to three dimensions. The first dimension is Writing Essentials, with three items related to synthesis, emotional control, and language. The second dimension is Relational Reflective Writing, with seven items related to relationship building with writing facilitators and the self through reflection. The third dimension is Creative Identity, with six items related to gaps in student achievement of transformative writing. Demographic data for age, gender, years in post-secondary, English language status, English writing status, and writing attitude are also included.
The survey has been validated in a published article [72]. We make use of this dataset in Chapter 8 [12], devoted to clustering algorithms. The dataset is published under the CC0 1.0, which means that anyone can copy, modify, distribute it, even for commercial purposes, without asking permission from the authors. The dataset variables are described below.
First, we describe the demographic variables, which can be previewed below.
- Age: Age.
- Gender: Student’s gender, 1 = male (24.91%), 2 = female (72.12%), 3 = non-binary (2.97%).
- WritingAttitude: Writing attitude, 1 = dislikes writing (44.73%), 2 = somewhere in between (14.37%), or 3 = likes writing (44.73%).
- TypeStudent: Academic level, 1 = undergraduate (67.29%), 2 = graduate (32.71%).
- Ugyears: Undergraduate years in the school for undergraduate students.
- Gryears: Graduate years in the school for graduate students.
- WriteEnglish: English writing status (1-5).
- SpeakEnglish: English language status (1-5).
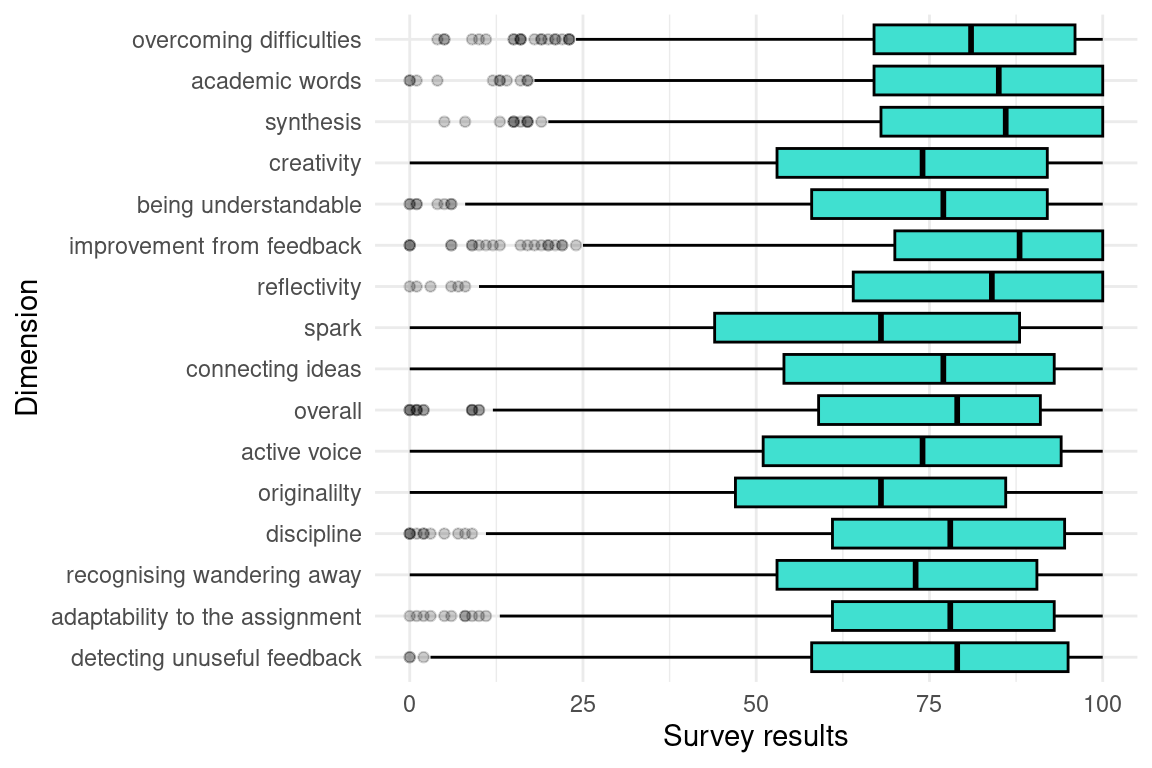
Next, we present the questionnaire responses for each of the dimensions. The responses are on a scale of 0-100. Below is a preview of the data, and Figure 2.8 presents a box plot with some the response distribution of the questionnaire.
Writing Essentials
- overcome: Response to the item “Even when the writing is hard, I can find ways to overcome my writing difficulties”.
- words: Response to the item “I can successfully use scholarly academic words and phrases when writing in my courses”.
- synthesize: Response to the item “I can combine or synthesize multiple sources I’ve read to create an original product or text”.
Relational Reflective Writing
- meaning: Response to the item “When I write, I can think about my audience and write so they clearly understand my meaning”.
- improve: Response to the item “When I receive feedback on my writing, no matter how it makes me feel, I can use that feedback to improve my writing in the future”.
- reflect: Response to the item “When I reflect on what I am writing I can make my writing better”.
- ideas: Response to the item “When I read articles about my topic, the connections I feel with the ideas of other authors can inspire me to express my own ideas in writing”.
- overall: Response to the item “When I look at the overall picture I’ve presented in my writing, I can assess how all the pieces tell the complete story of my topic or argument”.
- wander: Response to the item “I can recognize when I’ve wandered away from writing what my audience needs to know and have begun writing about interesting, but unrelated, ideas”.
- adapt: Response to the item “With each new writing assignment, I can adapt my writing to meet the needs of that assignment”.
- feedback: Response to the item “When I seek feedback on my writing, I can decide when that feedback should be ignored or incorporated into a revision in my writing”.
Creative Identity
- creativity: Response to the item “I can use creativity when writing an academic paper”.
- spark: Response to the item “I feel I can give my writing a creative spark and still sound professional”.
- voice: Response to the item “I feel I can develop my own writing voice (ways of speaking in my writing that are uniquely me)”.
- original: Response to the item “Even with very specific assignment guidelines, I can find ways of writing my assignment to make it original or unique”.
- discipline: Response to the item “I can comfortably express the concepts, language, and values of my discipline or major in my writing assignments”.
3.6 Educators’ discussions in a MOOC (SNA)
This dataset belongs to two offerings of the MOOC “The Digital Learning Transition in K-12 Schools” [73]. The course was aimed at helping school and district leaders implement digital learning initiatives in K-12 education. The objectives of the course were for participants to understand the advantages of digital learning in schools, to assess the specific goals for their own school, and to devise a plan to achieve such goals. The course consisted of five learning units dealing with the schools of the future, teaching and learning culture, successful digital transition, leading the transition, and crowd sourcing. The MOOCs were offered to American as well as international teachers. There were two offerings of the MOOC, with minor variations regarding duration and groups. The dataset contains the interactions of the MOOC discussion forums and concerns teachers’ communications throughout the courses. The dataset also contains the characteristics of the teachers, e.g., their professional roles, and experience.
The dataset is extensively described in a dedicated publication where the authors give details about the context and the courses, the files, and the fields contained in each file [74]. In this book, we use this dataset to illustrate dissimilarity-based clustering [39], Social Network Analysis [39] and Temporal Network Analysis [41]. The dataset is available with a CC0 1.0 license. Therefore, permission to copy, modify, and distribute, even for commercial purposes, is granted. As a standard Social Network Analysis dataset, it comes in two files for each of the courses (four in total), which we describe in detail below.
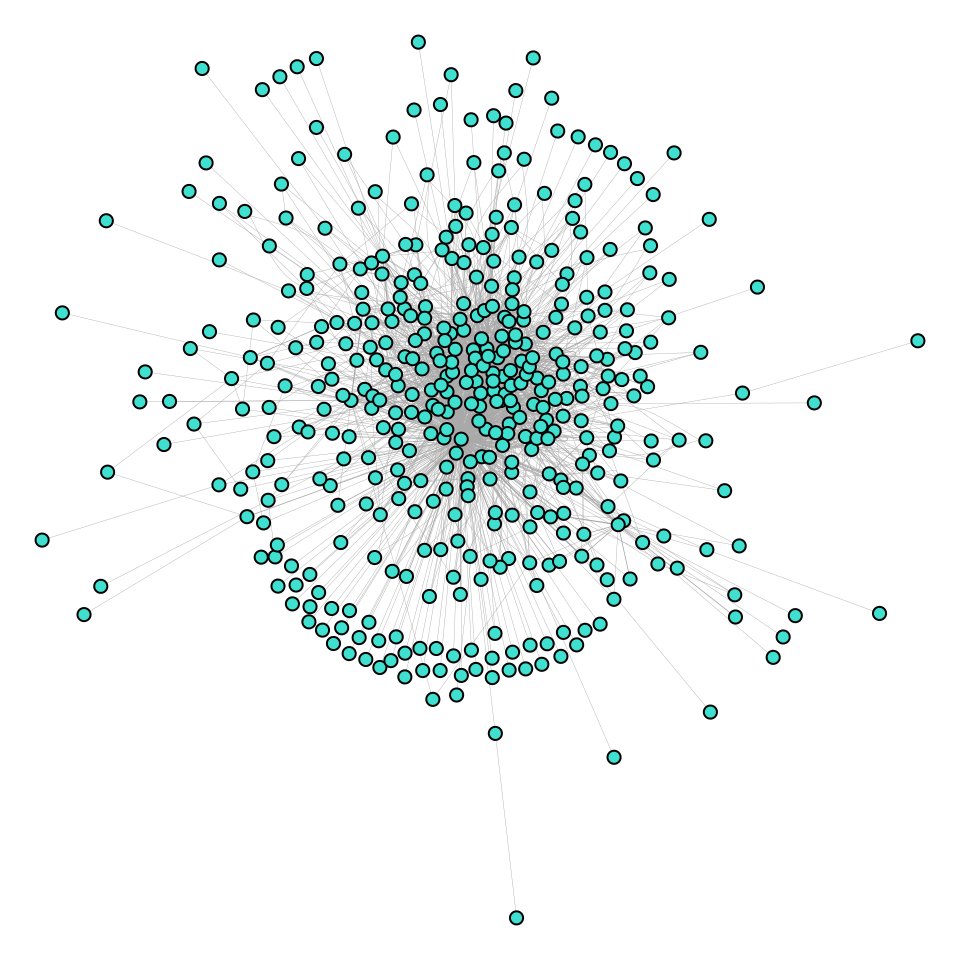
Edges file: This file defines who interacted (the source or the sender of the communication) with whom (the target or the receiver of the communication). The edges file comes with other metadata, such as time, discussion topic and group. Below is a preview of one of the edge files, and Figure 2.9 shows the network of collaboration between forum contributors.
- Sender: Source of the communication identifier (1-445).
- Receiver: Target of the communication identifier (1-445).
- Timestamp: Timestamp of the intervention in “m/d/Y H:M” format, ranging from April 10th 2013 to June 8th 2013.
- Discussion Title: Title of the discussion.
- Discussion Category: Category of the discussion.
Nodes file: The file defines the characteristics of the interacting teachers, their IDs, their professional status and expertise level. Below is a preview of one of the nodes file data.
- UID: Teacher identifier (1-445).
- role1: Role of the teacher.
- experience: Level of experience (1-3).
- experience2: Years of experience.
- country: Country of origin.
- gender: Teachers’ gender, female (68.09%); male (31.69%).
- expert: Level of expertise (0-1).
Centralities file: The file contains the centrality measures of the participants which indicate their number of contributions (
OutDegree), replies (InDegree), position in the network (Closeness_total), worth of their connections (Eigen), spread of their ideas (Diffusion_degree), and more. For more information on how to calculate centralities from interaction data, refer to Chapter 15 [39].- name: Teacher identifier (1-445).
- InDegree: In-degree centrality. Number of responses received.
- OutDegree: Out-degree centrality. Number of messages sent.
- Closeness_total: Closeness centrality. Position in the network.
- Betweenness: Betweenness centrality. Influential position.
- Eigen: Eigen centrality. Worth of connections.
- Diffusion.degree: Diffusion degree centrality [75]. Spread of ideas.
- Coreness: Coreness centrality. Spreading capability.
- Cross_clique_connectivity: Cross clique connectivity. Facilitation of information propagation.
3.7 High school learners’ interactions (SNA)
The next dataset [76] concerns a course of interactions among 30 students in a high school in Kenitra, Morocco. The course under examination had a duration of two months and covered topics related to computer science: the computer information system, algorithmis and programming. The course was implemented in the Moodle LMS, using the forum as a discussion space. Students’ interactions were aimed at communicating, discussing and exchanging knowledge among them.
The dataset has been analyzed using social network analysis, is briefly described in an article [77], and is shared under Creative Commons license CC BY 4.0, which means that anyone can share, copy and modify this dataset so long as appropriate credit is given. The dataset includes two files described below.
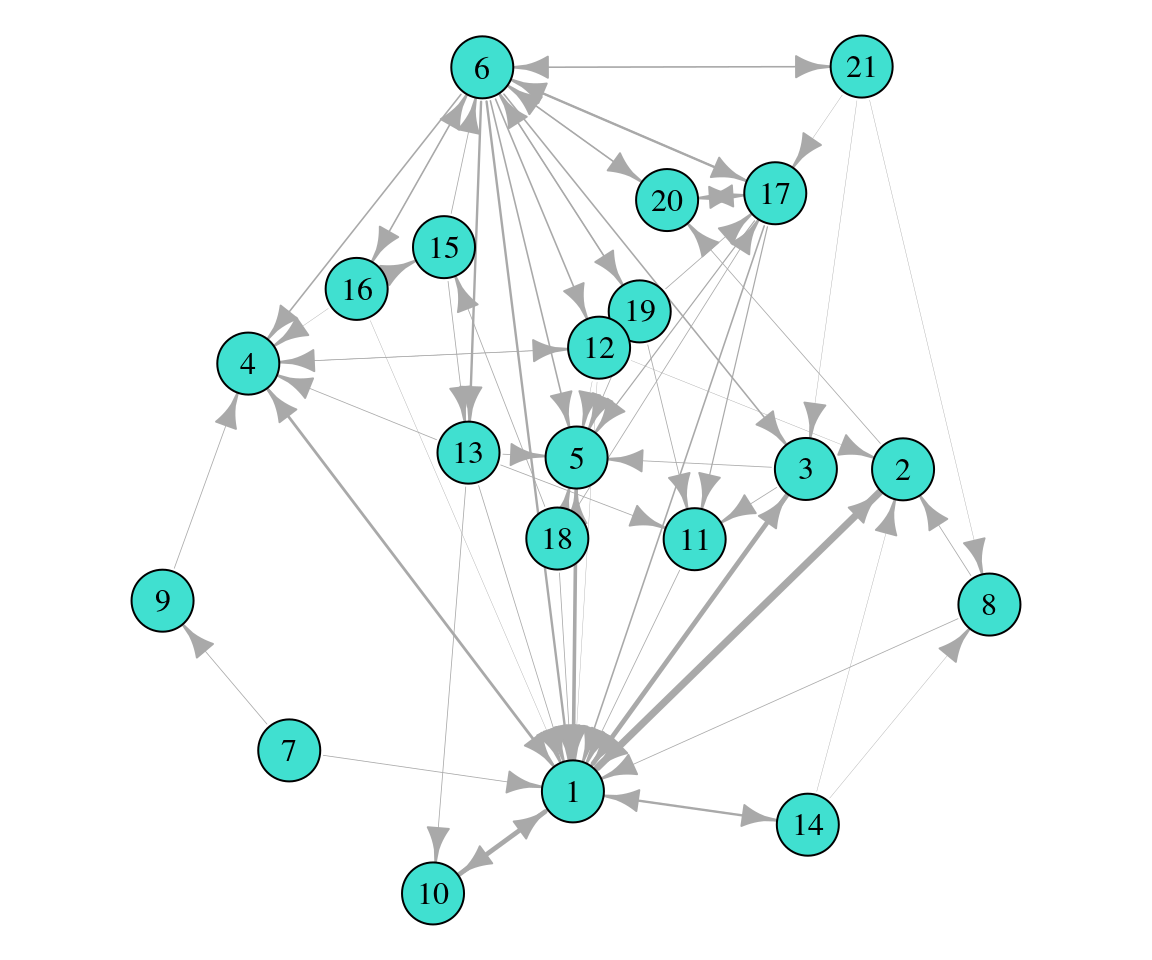
Edges file: The file contains the interactions source, target and weights. Below is a preview of the edge files. Figure 2.10 presents the graph of all the interactions on the network.
- source: Source node identifier (1-21).
- Target: Target node identifier (1-21).
- W: Weight of the link (the value is always 1).
Nodes file: contains the characteristics of the interacting students, e.g., gender and age. Below is a preview of the dataset.
- ID: Student identifier (1-30).
- Username: Username of the student.
- name: Name of the student.
- genre: Gender of the student F (n = 23); M (n = 7).
- Date de naissance: Birthdate of the student in format “D/M/Y”.
3.8 Interactions in an LMS forum from a programming course (SNA)
This dataset includes message board data collected from a programming undergraduate course in a higher education institution in Spain using the Moodle LMS. The most particular characteristic of the course is that it follows the CTMTC (Comprehensive Training Model of the Teamwork Competence) methodology [78], which allows individualized training and assessment of teamwork across all stages of teamwork-based learning: storming, norming, performing, delivery and documentation [79].
This is a mandatory course with a workload of 6 ECTS. The data dates back to the first semester of the 2014-2015 academic year. The course offers foundational knowledge on programming and numeric calculus, has a strong focus on the development of algorithms, and a hands-on approach to teaching. The course starts with a two-hour long introductory session; after this session, students work in class and out of class during the whole semester on a team project, following the CTMTC methodology. Individual evidence of teamwork is collected from forum activity, where the work phases are presented, and group evidence of teamwork is collected from Dropbox and wikis.
The dataset refers to individual evidence of teamwork; in other words, it contains information about forum interactions during the course. The original dataset, obtained from Moodle logs, was processed with the help of GraphFES [80] to provide condensed information. The output of GraphFES consists of three different datasets: views, or the number of times user a read a message posted by user b; replies, which informs about the number of replies from user a to user b; and messages, which provides a network with the hierarchical structure of messages in the forum. This dataset has been used previously in [81] and is now being publicly released under a CC 4.0 BY-NC-SA license, which means that anyone is free to share, adapt, and distribute the data as long as appropriate credit is given, it is not used for commercial purposes, and the original license is kept. The dataset is used in Chapter 16 [40] of this book, about community detection. This dataset presents the replies network, a directed graph, and consists of an edges file and a nodes file.
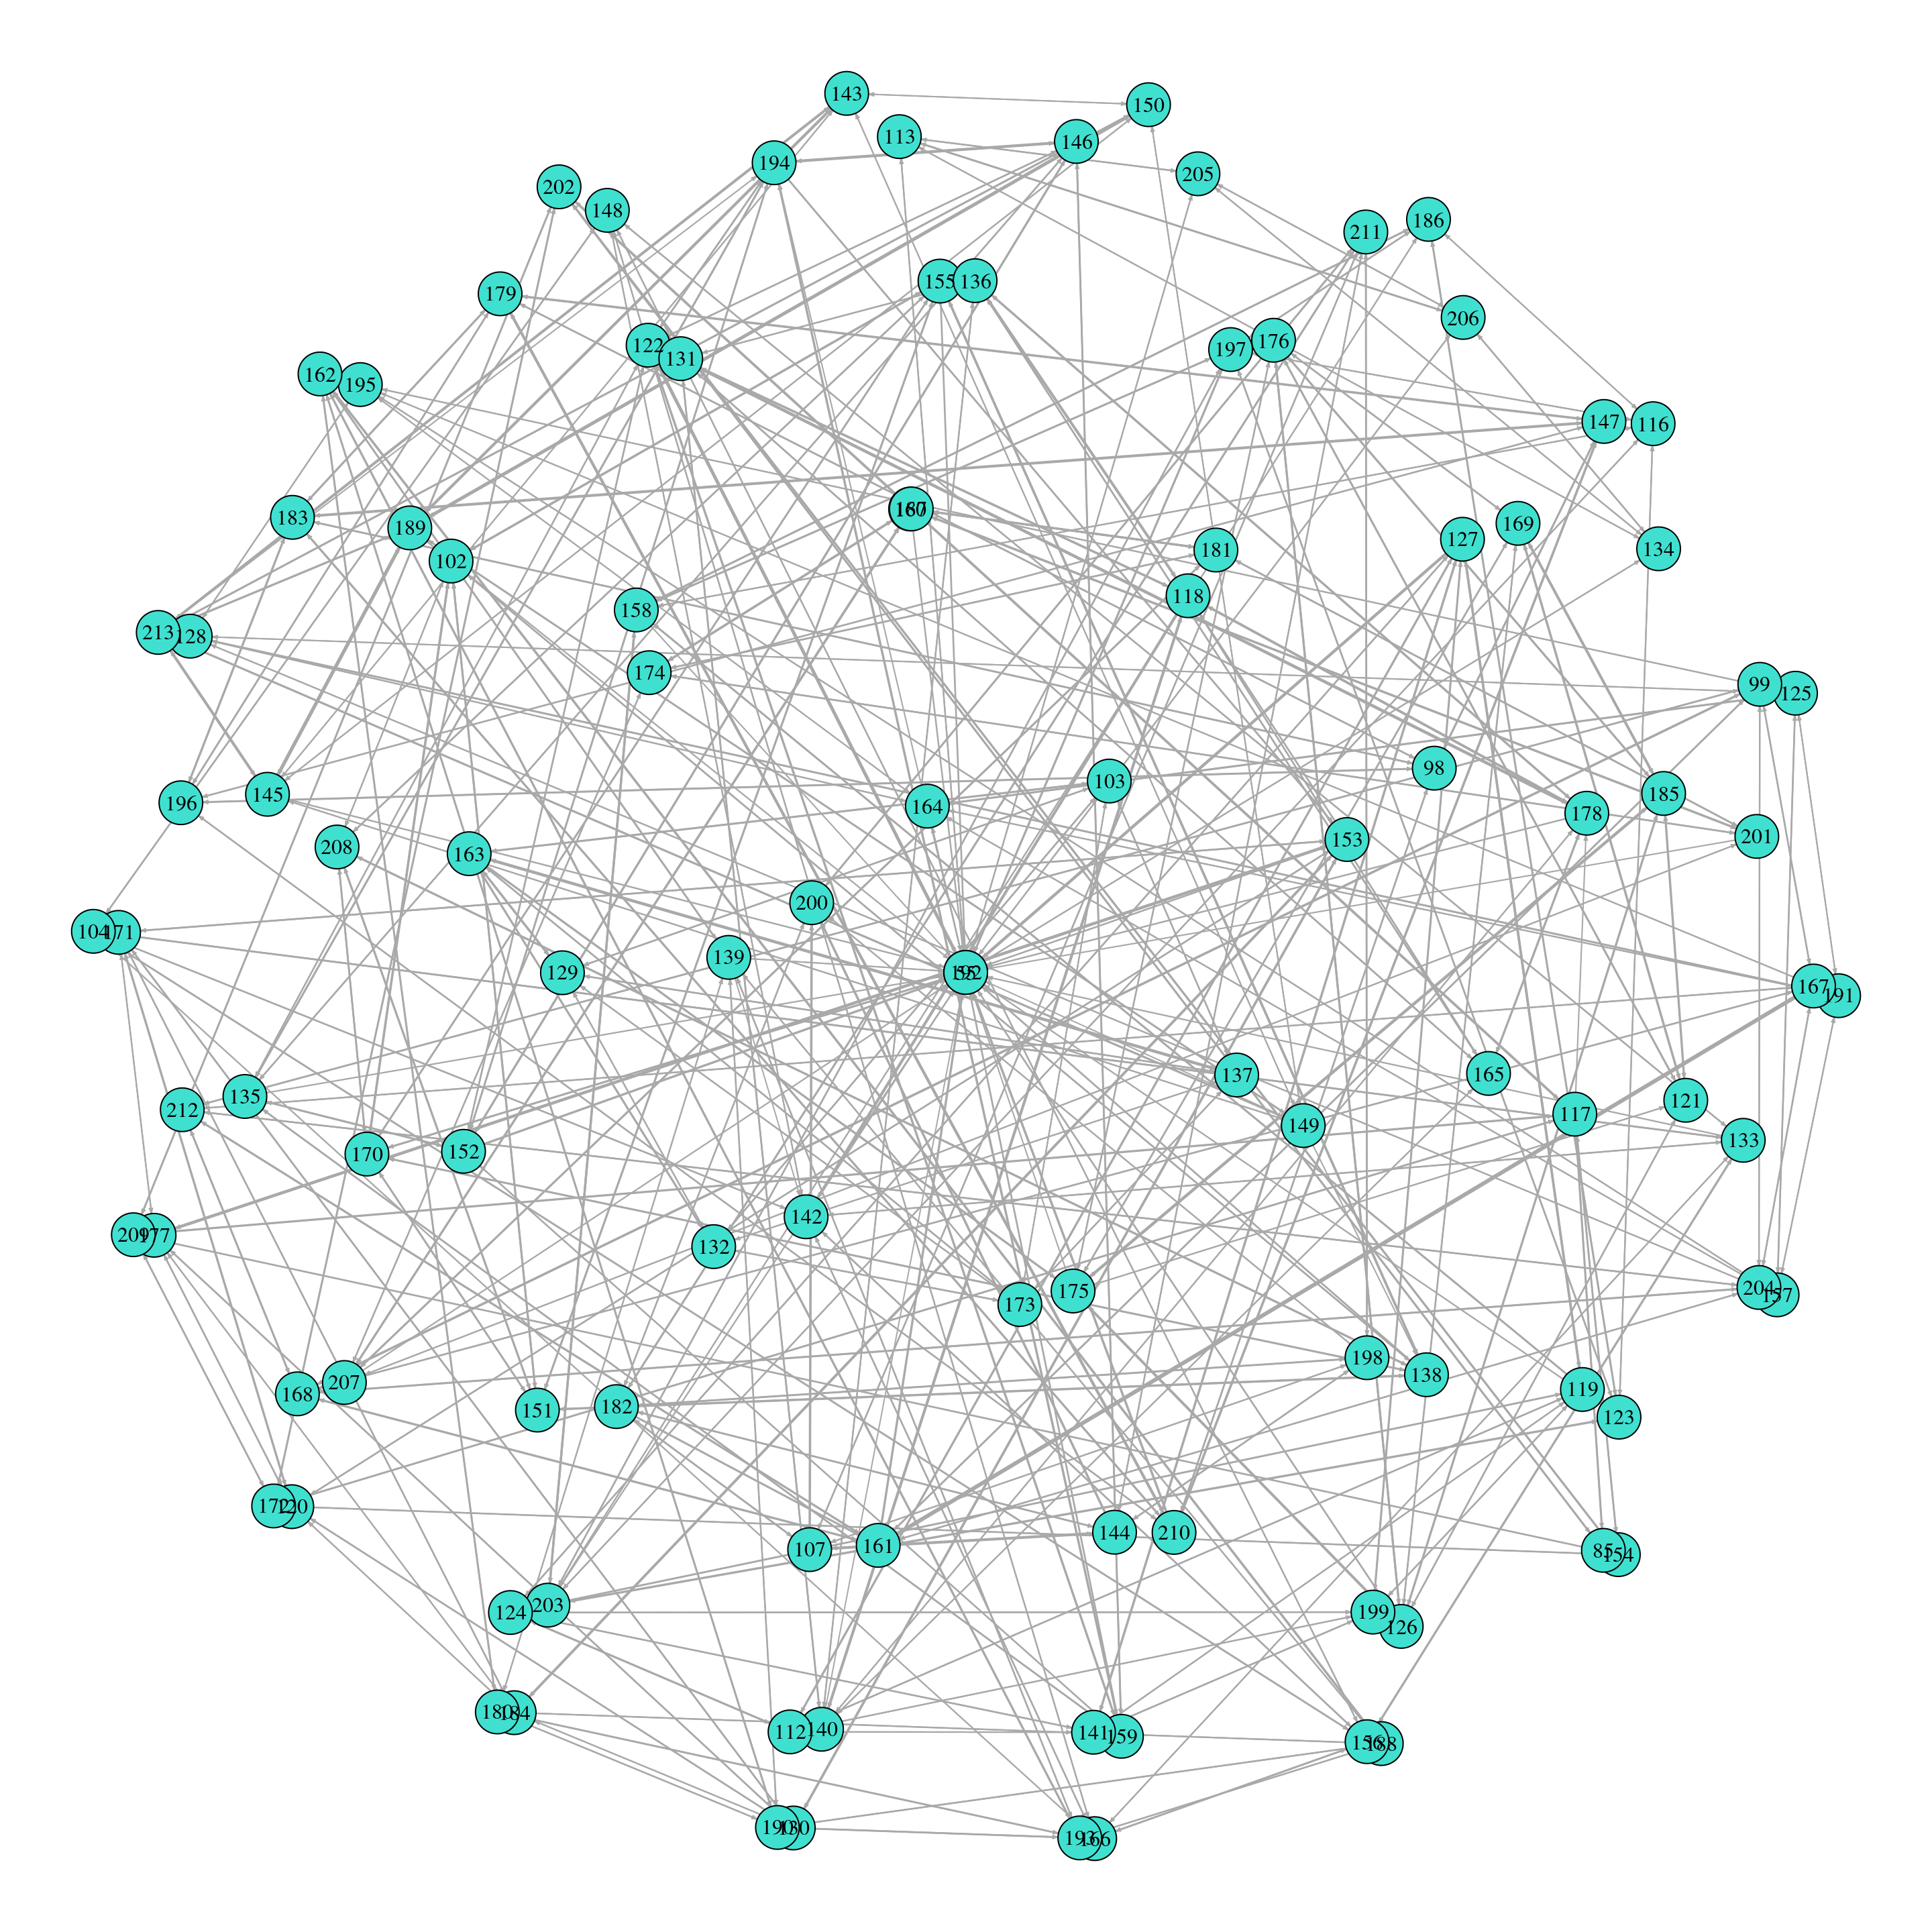
Edges file: this file includes information about who (attribute
source) interacted with (replied to) whom (attributetarget); in other words, the sender and the receiver of the informational exchange, and how many times that exchange happened during the course (attributeweight), considering all messages exchanged. The dataset includes a total of 662 weighed edges. Below is a preview of the edges file data, and Figure 2.11 represents the complete network of interactions among the Moodle users.- source: Source node identifier (108 distinct values).
- target: Target node identifier (108 distinct values).
- weight: Weight of the link.
Nodes file: this file contains information about all users with access to the course in the Moodle space, including students, instructors and administrators. The file includes a total of 124 nodes (users); of these, 110 users are students, distributed in 19 groups of between 5 and 7 members each. The file includes an identifier for each user (attribute
id), the username (attributeuser; after anonymization, all usernames have the formatuser_id), the number of initial posts, which refers to the number of first posts in a thread (attributeinitPosts), the number of replies, or posts that were a reply to another post (attributereplyPosts) and the total number of posts by that user in the forum (attributetotalPosts), which is the sum ofinitPostsandreplyPosts. It is worth noting thatuser_55, a central node of the network, corresponds to the main instructor of the course. Below is a preview of the nodes file.- User: User identifier. There are 124 distinct users.
- initPosts: Number of first posts in a thread.
- replyPosts: Number of replies to posts in a thread.
- totalPosts: Total number of posts by a user in the forum.
3.9 Engagement and achievement throughout a study program
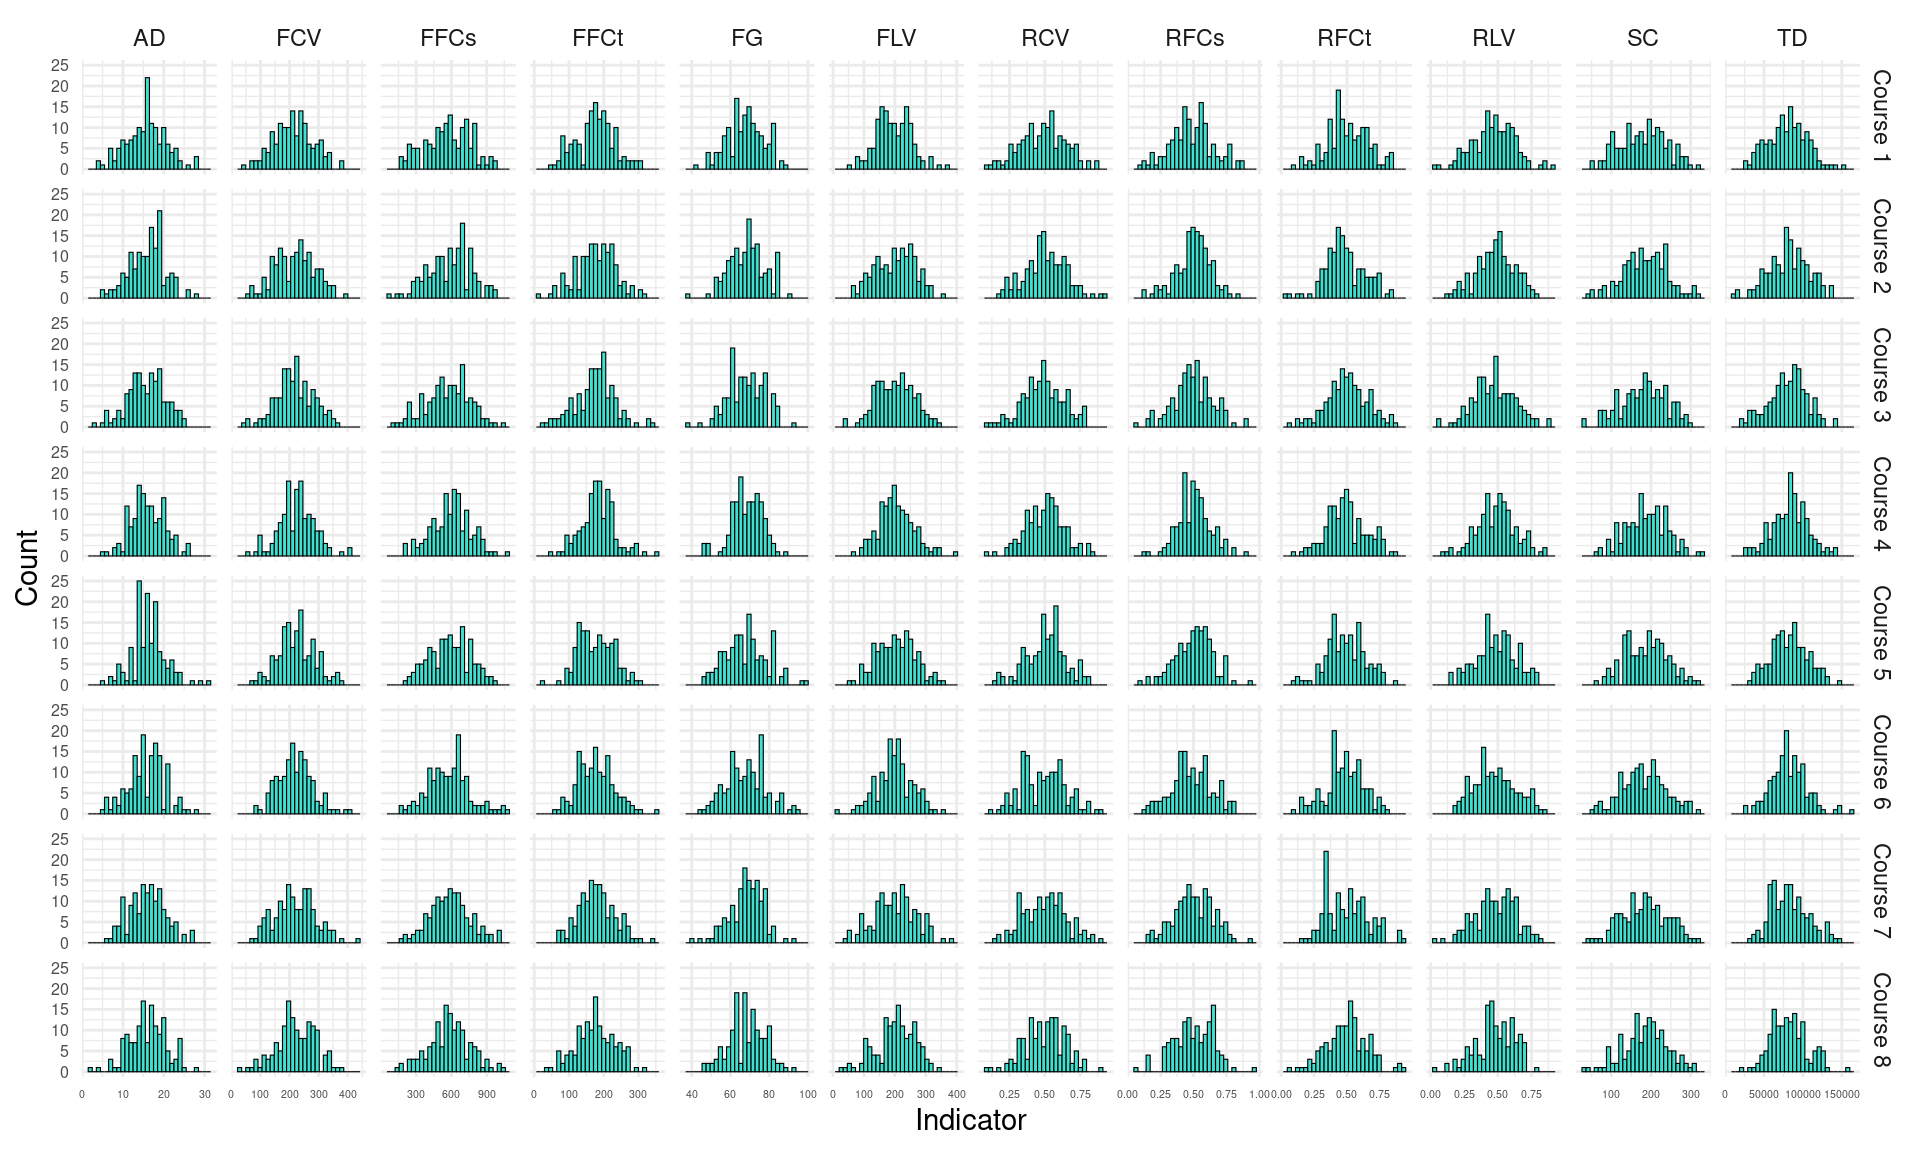
This dataset contains simulated data of students’ online engagement and academic achievement throughout a study program. The dataset has been simulated based on the results of a published article [25]. The article used students’ logs extracted from a university’s Moodle LMS for all the subjects and for all the students who attended the years: 2015, 2016, 2017 and 2018. The logs were used to derive indicators of engagement, such as frequency of performing learning activities (course browsing, forum consumption, forum contribution, and lecture viewing), session count, total session time, active days and regularity of each activity. Regularity of viewing the course main page, for example, was calculated by dividing main page browse actions for the given student over the total main page browse actions over the course duration; the resulting probabilities are used within a Shannon entropy formula to calculate the entropy.
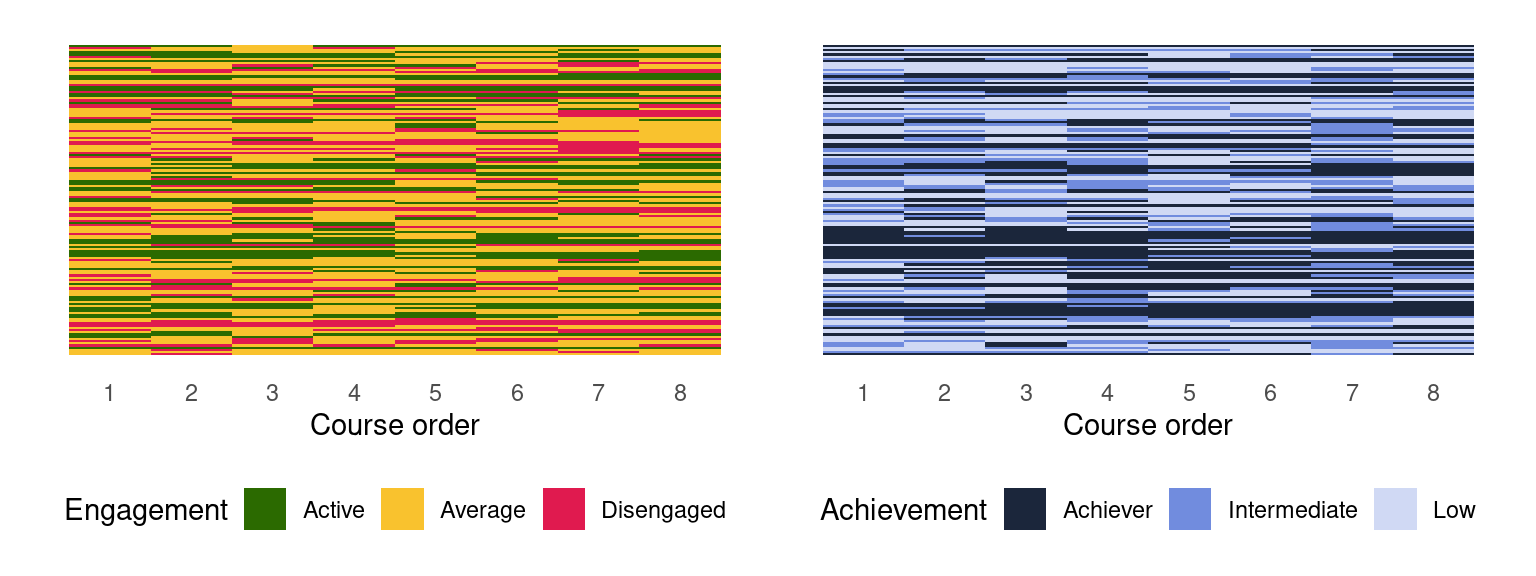
Then, Latent Class Analysis was used to cluster students into engagement states for each course: Active, Average or Disengaged. Achievement was measured through course final grades, which were divided into tertiles: Achiever, Intermediate and Low. Hence, for each course, students had an engagement state, and an achievement state. The motivation and process of deriving these states from students’ engagement indicators is explained in Chapter 11 [31].
The simulated dataset contains the data for 142 students for 8 sequential courses, including their engagement and achievement states, as well as covariate data. It is shared with a CC BY 4.0 license, which means that anyone is free to share, adapt, and distribute the data, as long as appropriate credit is given. The dataset is used in Chapter 13 [33] of this book, to illustrate multi-channel sequence analysis. A preview of the dataset can be seen below. A visual representation of the evolution of engagement and achievement throughout the program is depicted in Figure 2.13. The dataset contains two files:
3.9.1 Longitudinal engagement indicators and grades
The file LongitudinalEngagement.csv contains all of the engagement indicators per student and course (frequency, duration and regularity of learning activities) as well as the final grade. Each column is described below and a preview can be seen below and in Figure 2.12.
- UserID: User identifier. There are 142 distinct users.
- CourseID: Course identifier. There are 38 distinct courses.
- Sequence: Course sequence for the student (1-8).
- Freq_Course_View: Number of views of the course main page.
- Freq_Forum_Consume: Number of views of the forum posts.
- Freq_Forum_Contribute: Number of forum posts created.
- Freq_Lecture_View: Number of lectures viewed.
- Regularity_Course_View: Regularity of visiting the course main page.
- Regularity_Lecture_View: Regularity of visiting the lectures.
- Regularity_Forum_Consume: Regularity of reading forum posts.
- Regularity_Forum_Contribute: Regularity of writing forum posts.
- Session_Count: Number of online learning sessions.
- Total_Duration: Total activity time online.
- Active_Days: Number of active days (with online activity).
- Final_Grade: Final grade (0-100).
3.9.2 Longitudinal engagement and achievement states
The file SequenceEngagementAchievement.xlsx contains students’ engagement and achievement states for each course as well as covariates (their previous grade, their attitude towards learning, and their gender). Engagement states were obtained by applying model-based clustering techniques to the engagement indicators in the previous file. Achievement states were obtained in a similar way for the final grade. The dataset columns are described below and a preview of the data can be seen below and a graphical representation is shown in Figure 2.13.
- UserID: User identifier. There are 142 distinct users.
- CourseID: Course identifier. There are 38 distinct courses.
- Sequence: Course sequence for the student (1-8).
- Engagement: Engagement state. There are 3 distinct states: Active (29.93%), Average (47.98%), amd Disengaged (22.10%).
- Final_Grade: Final grade of each student for each course (1-100).
- Achievement: Achievement state calculated using model-based clustering. There are 3 distinct states: Achiever (39.26%), Intermediate (23.33%), and Low (37.41%).
- AchievementNtile: Achievement state calculated using tertiles. There are 3 distinct states: Achiever (33.27%), Intermediate (33.36%), and Low (33.36%).
- Prev_grade: GPA with which the student applied to the program (1-10).
- Attitude: Attitude towards learning (0-20).
- Gender: Gender (male/female). There are 44% females and 56% males.
3.10 University students’ basic need satisfaction, self-regulated learning and well-being during COVID-19
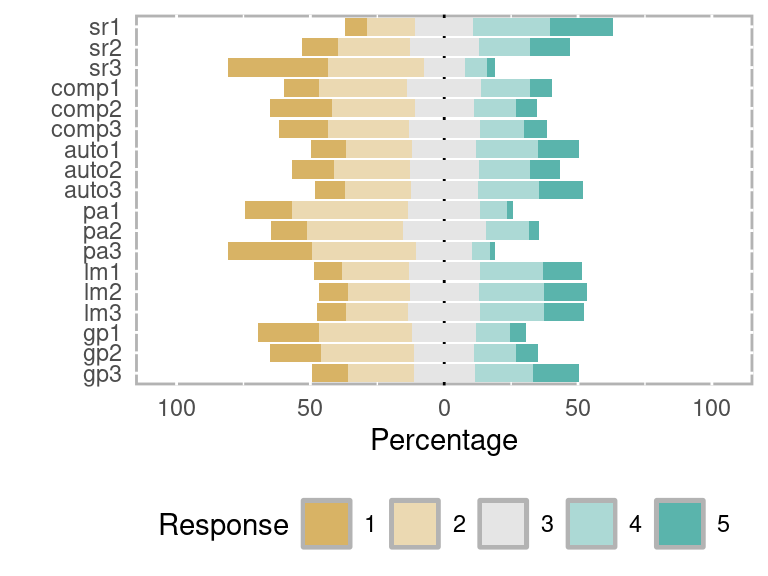
This dataset contains the results of a survey investigating students’ psychological characteristics related to their well-being during the COVID-19 pandemic. The variables under study are related to the satisfaction of basic psychological needs (relatedness, autonomy, and experienced competence), self-regulated learning, positive emotion and intrinsic learning motivation. Moreover, the dataset contains demographic variables, such as country, gender, and age. The data were collected from 6,071 students from Austria and Finland. There are, however, 564 records with missing responses to at least one item.
This dataset has been used in a published study to examine the relationships between the different variables using SEM [82]. The dataset has been used in Chapter 19 [21] of this book, to illustrate the implementation of psychological networks. The dataset has been published under a CC BY 4.0 license, which means that you are free to use and adapt the data but you must give appropriate credit, provide a link to the license, and indicate if changes were made. A summary of the responses is in Figure 2.14. Below, we describe each of the dataset columns and provide a preview of its content.
Demographic data
- country: Country of the student: 0 = Austria (78.60%), 1 = Finland (21.40%).
- gender: Gender of the student: 1 = Female (70.74%), 2 = Male (28.25%), 3 = Other (0.70%).
- age: Age of the student.
Below we describe the items of the questionnaire for each construct. The possible responses are: 1 = strongly agree, 2 = agree, 3 = somewhat agree, 4 = disagree, 5 = strongly disagree.
Basic Psychological Needs: Relatedness
- sr1: Response to the item “Currently, I feel connected with my fellow students”.
- sr2: Response to the item “Currently, I feel supported by my fellow students”.
- sr3: Response to the item “Currently, I feel connected with the people who are important to me (family, friends)”.
Basic Psychological Needs: Competence
- comp1: Response to the item “Currently, I am dealing well with the demands of my studies”.
- comp2: Response to the item “Currently, I have no doubts about whether I am capable of doing well in my studies”.
- comp3: Response to the item “Currently, I am managing to make progress in studying for university”.
Basic Psychological Needs: Autonomy
- auto1: Response to the item “Currently, I can define my own areas of focus in my studies”.
- auto2: Response to the item “Currently, I can perform tasks in the way that best suits me”.
- auto3: Response to the item “In the current home-learning situation, I seek out feedback when I need it”.
Positive Emotion
- pa1: Response to the item “I feel good”.
- pa2: Response to the item “I feel confident”.
- pa3: Response to the item “Even if things are difficult right now, I believe that everything will turn out all right”.
Intrinsic learning motivation
- lm1: Response to the item “Currently, doing work for university is really fun”.
- lm2: Response to the item “Currently, I am really enjoying studying and doing work for university”.
- lm3: Response to the item “Currently, I find studying for university really exciting”.
Self-regulated learning
- gp1: Response to the item “In the current home-learning situation, I plan my course of action”.
- gp2: Response to the item “In the current home-learning situation, I think about how I want to study before I start”.
- gp3: Response to the item “In the current home-learning situation, I formulate learning goals that I use to orient my studying”.
4 Discussion
In this chapter, we have provided an overview of the types of data operationalized in learning analytics research. Our journey encompassed a wide spectrum of data types, ranging from foundational demographic information to the footprints left by the interactions of students with online learning technologies, including clicks, activities, social interactions, and assessment data. We have pointed to some of the most commonly employed analytical techniques for each type of data and we referred the reader to the chapters of the book that have covered each type of analysis. Thereafter, we presented a meticulous curation of illustrative datasets. We have described each dataset in detail, describing and representing the relevant variables. We also acknowledged the ways each dataset have been analyzed throughout the remaining chapters of the book.
We must disclose that collecting learners’ data is not an easy endeavor. First and foremost, it is crucial to consider the ethical implications of collecting and using different types of data, and to comply with data protection laws and regulations [14]. Moreover, it is important to ensure the data quality to draw relevant conclusions from the data, especially in scenarios where data come from heterogeneous sources and are provided in large quantities [83], such as in the educational field [84]. These requirements make finding good-quality open datasets online extremely challenging. In this regard, we hope that the selection offered in this chapter is useful for the reader beyond the scope of the book. A few articles have offered other dataset collections suitable for learning analytics [85] or educational data mining [86]. Moreover, the reader is encouraged to consult open data repositories where datasets are continuously published in multiple fields: Zenodo (https://zenodo.org), US Department of Education Open Data Platform (https://data.ed.gov), Harvard Dataverse (https://dataverse.harvard.edu), European Data Portal (https://data.europa.eu), Mendeley Data (https://data.mendeley.com), openICPSR (https://www.openicpsr.org), Google Dataset Search (https://datasetsearch.research.google.com), figshare (https://figshare.com), Open Science Framework (https://osf.io), or data.world (https://data.world).
References
1.
Sclater N (2017) Data. In: Learning analytics explained. Routledge, pp 78–87
2.
Nistor N, Hernández-García Á (2018) What types of data are used in learning analytics? An overview of six cases. Computers in Human Behavior 89:335–338. https://doi.org/10.1016/j.chb.2018.07.038
3.
Li W, Sun K, Schaub F, Brooks C (2021) Disparities in Students’ Propensity to Consent to Learning Analytics. International Journal of Artificial Intelligence in Education 32:564–608. https://doi.org/10.1007/s40593-021-00254-2
4.
Rodríguez-Hernández CF, Cascallar E, Kyndt E (2020) Socio-economic status and academic performance in higher education: A systematic review. Educational Research Review 29:100305. https://doi.org/10.1016/j.edurev.2019.100305
5.
Mengash HA (2020) Using data mining techniques to predict student performance to support decision making in university admission systems. IEEE Access 8:55462–55470. https://doi.org/10.1109/access.2020.2981905
6.
Mullen CA (2019) Does modality matter? A comparison of aspiring leaders’ learning online and face-to-face. Journal of Further and Higher Education 44:670–688. https://doi.org/10.1080/0309877x.2019.1576859
7.
Tikka S, Kopra J, Heinäniemi M, López-Pernas S, Saqr M (2024) Basics of R. In: Saqr M, López-Pernas S (eds) Learning analytics methods and tutorials: A practical guide using R. Springer, pp in–press
8.
Kopra J, Tikka S, Heinäniemi M, López-Pernas S, Saqr M (2024) Data cleaning and wrangling. In: Saqr M, López-Pernas S (eds) Learning analytics methods and tutorials: A practical guide using R. Springer, pp in–press
9.
López-Pernas S, Misiejuk K, Tikka S, Saqr M, Kopra J, Heinäniemi M (2024) Visualizing and reporting educational data with r. In: Saqr M, López-Pernas S (eds) Learning analytics methods and tutorials: A practical guide using R. Springer, pp in–press
10.
Meaney M, Fikes T (2022) Adding a demographic lens to cluster analysis of participants in entry-level massive open online courses (MOOCs). Proceedings of the Ninth ACM Conference on Learning @ Scale. https://doi.org/10.1145/3491140.3528306
11.
Scrucca L, Saqr M, López-Pernas S, Murphy K (2024) An introduction and r tutorial to model-based clustering in education via latent profile analysis. In: Saqr M, López-Pernas S (eds) Learning analytics methods and tutorials: A practical guide using R. Springer, pp in–press
12.
Murphy K, López-Pernas S, Saqr M (2024) Dissimilarity-based cluster analysis of educational data: A comparative tutorial using r. In: Saqr M, López-Pernas S (eds) Learning analytics methods and tutorials: A practical guide using R. Springer, pp in–press
13.
Du X, Yang J, Shelton BE, Hung J-L, Zhang M (2019) A systematic meta-Review and analysis of learning analytics research. Behaviour & Information Technology 40:49–62. https://doi.org/10.1080/0144929x.2019.1669712
14.
Slade S, Prinsloo P (2013) Learning Analytics. American Behavioral Scientist 57:1510–1529. https://doi.org/10.1177/0002764213479366
15.
Tempelaar D, Rienties B, Nguyen Q (2021) The contribution of dispositional learning analytics to precision education. Educational Technology & Society 24:109–122
16.
Brenner PS, DeLamater J (2016) Lies, Damned Lies, and Survey Self-Reports? Identity as a Cause of Measurement Bias. Social Psychology Quarterly 79:333–354. https://doi.org/10.1177/0190272516628298
17.
Tikka S, Kopra J, Heinäniemi M, López-Pernas S, Saqr M (2024) Basic statistics with R. In: Saqr M, López-Pernas S (eds) Learning analytics methods and tutorials: A practical guide using R. Springer, pp in–press
18.
Oster M, Lonn S, Pistilli MD, Brown MG (2016) The learning analytics readiness instrument. Proceedings of the Sixth International Conference on Learning Analytics & Knowledge - LAK ’16. https://doi.org/10.1145/2883851.2883925
19.
Vogelsmeier LVDE, Saqr M, López-Pernas S, Jongerling J (2024) Factor analysis in education research using R. In: Saqr M, López-Pernas S (eds) Learning analytics methods and tutorials: A practical guide using R. Springer, pp in–press
20.
Jongerling J, López-Pernas S, Saqr M, Vogelsmeier L (2024) Structural equation modeling with R for education scientists. In: Saqr M, López-Pernas S (eds) Learning analytics methods and tutorials: A practical guide using R. Springer, pp in–press
21.
Saqr M, Beck E, López-Pernas S (2024) Psychological networks. In: Saqr M, López-Pernas S (eds) Learning analytics methods and tutorials: A practical guide using R. Springer, pp in–press
22.
Ullmann T, Rienties B (2021) Using text analytics to understand open-ended student comments at scale: Insights from four case studies. Springer International Publishing, pp 211–233
23.
Henrie CR, Bodily R, Larsen R, Graham CR (2017) Exploring the potential of LMS log data as a proxy measure of student engagement. Journal of Computing in Higher Education 30:344–362. https://doi.org/10.1007/s12528-017-9161-1
24.
Alvarez P, Fabra J, Hernandez S, Ezpeleta J (2016) Alignment of teacher’s plan and students’ use of LMS resources. Analysis of moodle logs. 2016 15th International Conference on Information Technology Based Higher Education and Training (ITHET). https://doi.org/10.1109/ithet.2016.7760720
25.
Saqr M, López-Pernas S (2021) The longitudinal trajectories of online engagement over a full program. Computers & Education 175:104325. https://doi.org/10.1016/j.compedu.2021.104325
26.
Jovanović J, Gašević D, Dawson S, Pardo A, Mirriahi N (2017) Learning analytics to unveil learning strategies in a flipped classroom. The Internet and Higher Education 33:74–85. https://doi.org/10.1016/j.iheduc.2017.02.001
27.
López-Pernas S, Saqr M (2024) Process mining. In: Saqr M, López-Pernas S (eds) Learning analytics methods and tutorials: A practical guide using R. Springer, pp in–press
28.
Ahmad Uzir N, Gašević D, Matcha W, Jovanović J, Pardo A, Lim L-A, Gentili S (2019) Discovering time management strategies in learning processes using process mining techniques. Springer International Publishing, pp 555–569
29.
Saqr M, López-Pernas S, Jovanović J, Gašević D (2023) Intense, turbulent, or wallowing in the mire: A longitudinal study of cross-course online tactics, strategies, and trajectories. The Internet and Higher Education 57:100902. https://doi.org/10.1016/j.iheduc.2022.100902
30.
Saqr M, López-Pernas S, Helske S, Durand M, Murphy K, Studer M, Ritschard G (2024) Sequence analysis in education: Principles, technique, and tutorial with r. In: Saqr M, López-Pernas S (eds) Learning analytics methods and tutorials: A practical guide using R. Springer
31.
López-Pernas S, Saqr M (2024) Modelling the dynamics of longitudinal processes in education. A tutorial with R for the VaSSTra method. In: Saqr M, López-Pernas S (eds) Learning analytics methods and tutorials: A practical guide using R. Springer, pp in–press
32.
Helske J, Helske S, Saqr M, López-Pernas S, Murphy K (2024) A modern approach to transition analysis and process mining with markov models: A tutorial with R. In: Saqr M, López-Pernas S (eds) Learning analytics methods and tutorials: A practical guide using R. Springer, pp in–press
33.
López-Pernas S, Saqr M, Helske S, Murphy K (2024) Multichannel sequence analysis in educational research using r. In: Saqr M, López-Pernas S (eds) Learning analytics methods and tutorials: A practical guide using R. Springer, pp in–press
34.
Matcha W, Gašević D, Ahmad Uzir N, Jovanović J, Pardo A, Maldonado-Mahauad J, Pérez-Sanagustín M (2019) Detection of learning strategies: A comparison of process, sequence and network analytic approaches. Springer International Publishing, pp 525–540
35.
Saqr M, López-Pernas S (2022) How CSCL roles emerge, persist, transition, and evolve over time: A four-year longitudinal study. Computers & Education 189:104581. https://doi.org/10.1016/j.compedu.2022.104581
36.
Saqr M, López-Pernas S (2021) Modelling diffusion in computer-supported collaborative learning: a large scale learning analytics study. International Journal of Computer-Supported Collaborative Learning 16:441–483. https://doi.org/10.1007/s11412-021-09356-4
37.
Dowell NMM, Nixon TM, Graesser AC (2018) Group communication analysis: A computational linguistics approach for detecting sociocognitive roles in multiparty interactions. Behavior Research Methods 51:1007–1041. https://doi.org/10.3758/s13428-018-1102-z
38.
Saqr M, Elmoazen R, Tedre M, López-Pernas S, Hirsto L (2022) How well centrality measures capture student achievement in computer-supported collaborative learning? A systematic review and meta-analysis. Educational Research Review 35:100437. https://doi.org/10.1016/j.edurev.2022.100437
39.
Saqr M, López-Pernas S, Conde MÁ, Hernández-García Á (2024) Social network analysis: A primer, a guide and a tutorial in R. In: Saqr M, López-Pernas S (eds) Learning analytics methods and tutorials: A practical guide using R. Springer, pp in–press
40.
Hernández-Garcı́a Á, Cuenca-Enrique C, Traxler A, López-Pernas S, Conde MÁ, Saqr M (2024) Community detection in learning networks using R. In: Saqr M, López-Pernas S (eds) Learning analytics methods and tutorials: A practical guide using R. Springer, pp in–press
41.
Saqr M (2024) Temporal network analysis: Introduction and methods and analysis with R. In: Saqr M, López-Pernas S (eds) Learning analytics methods and tutorials: A practical guide using R. Springer, pp in–press
42.
Shaffer DW, Collier W, Ruis AR (2016) A tutorial on epistemic network analysis: Analyzing the structure of connections in cognitive, social, and interaction data. Journal of Learning Analytics 3:9–45. https://doi.org/10.18608/jla.2016.33.3
43.
Tan Y, Swiecki Z, Ruis A, Shaffer D (2024) Epistemic network analysis and ordered network analysis in learning analytics. In: Saqr M, López-Pernas S (eds) Learning analytics methods and tutorials: A practical guide using R. Springer, pp in–press
44.
Teasley SD (2019) Learning analytics: where information science and the learning sciences meet. Information and Learning Sciences 120:59–73. https://doi.org/10.1108/ils-06-2018-0045
45.
Gordillo A, Lopez-Fernandez D, Lopez-Pernas S, Quemada J (2020) Evaluating an educational escape room conducted remotely for teaching software engineering. IEEE Access 8:225032–225051. https://doi.org/10.1109/access.2020.3044380
46.
Li KC, Wong BTM (2020) The use of student response systems with learning analytics: a review of case studies (2008-2017). International Journal of Mobile Learning and Organisation 14:63. https://doi.org/10.1504/ijmlo.2020.103901
47.
Namoun A, Alshanqiti A (2020) Predicting Student Performance Using Data Mining and Learning Analytics Techniques: A Systematic Literature Review. Applied Sciences 11:237. https://doi.org/10.3390/app11010237
48.
Jovanovic J, López-Pernas S, Saqr M (2024) Predictive modelling in learning analytics using R. In: Saqr M, López-Pernas S (eds) Learning analytics methods and tutorials: A practical guide using R. Springer, pp in–press
49.
Saqr M, López-Pernas S (2022) The curious case of centrality measures: A large-scale empirical investigation. Journal of Learning Analytics 9:13–31. https://doi.org/10.18608/jla.2022.7415
50.
Blikstein P (2013) Multimodal learning analytics. In: Proceedings of the third international conference on learning analytics and knowledge. Association for Computing Machinery, New York, NY, USA, pp 102–106
51.
Mu S, Cui M, Huang X (2020) Multimodal data fusion in learning analytics: A systematic review. Sensors 20: https://doi.org/10.3390/s20236856
52.
Sharma K, Giannakos M (2020) Multimodal data capabilities for learning: What can multimodal data tell us about learning? British Journal of Educational Technology 51:1450–1484. https://doi.org/10.1111/bjet.12993
53.
Kubsch M, Caballero D, Uribe P (2022) Once more with feeling: Emotions in multimodal learning analytics. In: Giannakos M, Spikol D, Di Mitri D, Sharma K, Ochoa X, Hammad R (eds) The multimodal learning analytics handbook. Springer International Publishing, Cham, pp 261–285
54.
Bleck M, Le N-T (2022) A physiology-aware learning analytics framework. In: Giannakos M, Spikol D, Di Mitri D, Sharma K, Ochoa X, Hammad R (eds) The multimodal learning analytics handbook. Springer International Publishing, Cham, pp 231–257
55.
Saqr M, López-Pernas S (2024) Why learning and teaching learning analytics is hard: An experience from a real-life LA course using LA methods. In: Proceedings of the eleventh international conference on technological ecosystems for enhancing multiculturality (TEEM’23). Springer, Bragança, Portugal, pp in press
56.
Hasan R, Palaniappan S, Mahmood S, Abbas A, Sarker KU (2021) Dataset of students’ performance using student information system, moodle and the mobile application ’eDify’. Data 6: https://doi.org/10.3390/data6110110
57.
58.
Hasan R, Palaniappan S, Raziff ARA, Mahmood S, Sarker KU (2018) Student academic performance prediction by using decision tree algorithm. In: 2018 4th international conference on computer and information sciences (ICCOINS). IEEE, pp 1–5
59.
Hasan R, Palaniappan S, Mahmood S, Sarker KU, Abbas A (2020) Modelling and predicting student’s academic performance using classification data mining techniques. International Journal of Business Information Systems 34:403–422
60.
Rodríguez S, Valle A, Piñeiro I, Vieites T, González-Suárez R, Rodríguez-Llorente C (2020) School engagement, SRL and academic achievement
61.
Fredricks JA, Blumenfeld P, Friedel J, Paris A (2005) School engagement. What do children need to flourish? Conceptualizing and measuring indicators of positive development 305–321
62.
Cleary TJ (2006) The development and validation of the self-regulation strategy inventory—self-report. Journal of school psychology 44:307–322
63.
Estévez I, Rodríguez-Llorente C, Piñeiro I, González-Suárez R, Valle A (2021) School engagement, academic achievement, and self-regulated learning. Sustainability 13: https://doi.org/10.3390/su13063011
64.
Prasojo LD, Habibi A, Yaakob MFM, Pratama R, Yusof MR, Mukminin A, Suyanto, Hanum F (2020) Teachers’ burnout: A SEM analysis in an asian context. Heliyon 6:e03144. https://doi.org/10.1016/j.heliyon.2019.e03144
65.
Villa A, Calvete E (2001) Development of the teacher self-concept evaluation scale and its relation to burnout. Studies in Educational Evaluation 27:239–255. https://doi.org/10.1016/s0191-491x(01)00028-1
66.
Yu G, Xin T, Shen J (1995) Teacher’s sense of teaching efficacy: Its structure and influencing factors. Acta Psychologica Sinica 27:159
67.
Champion DF, Westbrook BW (1984) Maslach burnout inventory. Measurement and Evaluation in Counseling and Development 17:100–102. https://doi.org/10.1080/07481756.1984.12022754
68.
Prasojo LD, Habibi A, Yaakob MFM, Pratama R, Yusof MR, Mukminin A, Suyanto, Hanum F (2020) Dataset relating to the relationship between teacher self-concept and teacher efficacy as the predictors of burnout: A survey in indonesian education. Data in Brief 30:105448. https://doi.org/10.1016/j.dib.2020.105448
69.
Mitchell K (2020) Interdisciplinary undergraduate and graduate student data
70.
Bandura A, Freeman WH, Lightsey R (1999) Self-efficacy: The exercise of control. Journal of Cognitive Psychotherapy 13:158–166. https://doi.org/10.1891/0889-8391.13.2.158
71.
Pajares F, Valiante G (2006) Self-Efficacy beliefs and motivation in writing development. In: Handbook of writing research. The Guilford Press, New York, NY, US, pp 158–170
72.
Mitchell KM, McMillan DE, Lobchuk MM, Nickel NC, Rabbani R, Li J (2021) Development and validation of the situated academic writing self-efficacy scale (SAWSES). Assessing Writing 48:100524. https://doi.org/10.1016/j.asw.2021.100524
73.
Kellogg S, Edelmann A (2015) Massively open online course for educators (MOOC-ed) network dataset
74.
Kellogg S, Edelmann A (2015) Massively Open Online Course for Educators (MOOC-Ed) network dataset. British Journal of Educational Technology 46:977–983. https://doi.org/10.1111/bjet.12312
75.
Saqr M, López-Pernas S (2021) Modelling diffusion in computer-supported collaborative learning: A large scale learning analytics study. International Journal of Computer-Supported Collaborative Learning 16:441–483. https://doi.org/10.1007/s11412-021-09356-4
76.
Adraoui M (2022) Dataset of learners’ interactions in forum discussions
77.
Adraoui M, Retbi A, Idrissi MK, Bennani S (2017) Social learning analytics to describe the learners interaction in online discussion forum in moodle. In: 2017 16th international conference on information technology based higher education and training (ITHET). IEEE
78.
Lerı́s D, Fidalgo Á, Sein Echaluce ML (2014) A comprehensive training model of the teamwork competence. International Journal of Learning and Intellectual Capital 11:1. https://doi.org/10.1504/ijlic.2014.059216
79.
Fidalgo-Blanco Á, Leris D, Sein-Echaluce ML, Garcı́a-Peñalvo FJ, others (2015) Monitoring indicators for CTMTC: Comprehensive training model of the teamwork competence in engineering domain
80.
Chaparro-Peláez J, Acquila-Natale E, Iglesias-Pradas S, Suárez-Navas I (2015) A web services-based application for LMS data extraction and processing for social network analysis. In: New information and communication technologies for knowledge management in organizations. Springer International Publishing, pp 110–121
81.
Hernández-Garcı́a Á, Suárez-Navas I (2016) GraphFES: A web service and application for moodle message board social graph extraction. In: Big data and learning analytics in higher education. Springer International Publishing, pp 167–194
82.
Holzer J, Lüftenegger M, Korlat S, Pelikan E, Salmela-Aro K, Spiel C, Schober B (2021) Higher education in times of COVID-19: University students’ basic need satisfaction, self-regulated learning, and well-being. AERA Open 7:233285842110031. https://doi.org/10.1177/23328584211003164
83.
Becker D, King TD, McMullen B (2015) Big data, big data quality problem. In: 2015 IEEE international conference on big data (big data). pp 2644–2653
84.
Klašnja-Milićević A, Ivanović M, Budimac Z (2017) Data science in education: Big data and learning analytics. Computer Applications in Engineering Education 25:1066–1078. https://doi.org/10.1002/cae.21844
85.
Dietze S, Siemens G, Taibi D, Drachsler H (2016) Editorial: Datasets for learning analytics. Journal of Learning Analytics 3:307–311. https://doi.org/10.18608/jla.2016.32.15
86.
Mihaescu MC, Popescu PS (2021) Review on publicly available datasets for educational data mining. WIREs Data Mining and Knowledge Discovery 11: https://doi.org/10.1002/widm.1403
2.4 Social interaction data
Social interaction data in learning analytics refers to the data collected about students’ interactions with each other (and sometimes teachers too) in a learning environment, social media, or messaging platforms. This can include data such as the frequency and nature of interactions, the content of discussions, and the participation of students in group work or collaborative activities. Social interaction data can be used to understand how students are engaging with each other and to identify patterns or roles that students assume [35]. For example, if a student is not participating in group discussions, it may indicate that they are feeling disengaged or are having difficulty understanding the material. Furthermore, social interaction data can be used to study how students’ depth of contributions to the discussion influences performance [36]. For example, an analysis of social interaction data may reveal that students who receive more replies from other students perform better in the course than students whose contributions do not spark a lot of interest.
Social Network Analysis (SNA) is the most common method to study social interaction data. SNA comprises a wealth of quantitative metrics that summarize relationships in a network. In most cases in learning analytics, this network is formed based on students’ interactions. These metrics, named centrality measures, pave the path to apply other analytical methods such as cluster analysis to detect collaboration roles [37], or predictive analytics to determine whether performance can be predicted from students’ centrality measures [38]. We cover the basics of SNA in Chapter 15 of the book [39], community finding in Chapter 16 [40], and temporal network analysis in Chapter 17 [41]. Moreover, the nature and content of students’ interactions can be analyzed with Epistemic Network Analysis (ENA), a method for detecting and quantifying connections between elements in coded data and representing them in dynamic network models [42]. We cover this method in Chapter 18 [43].